
Fig. 4.
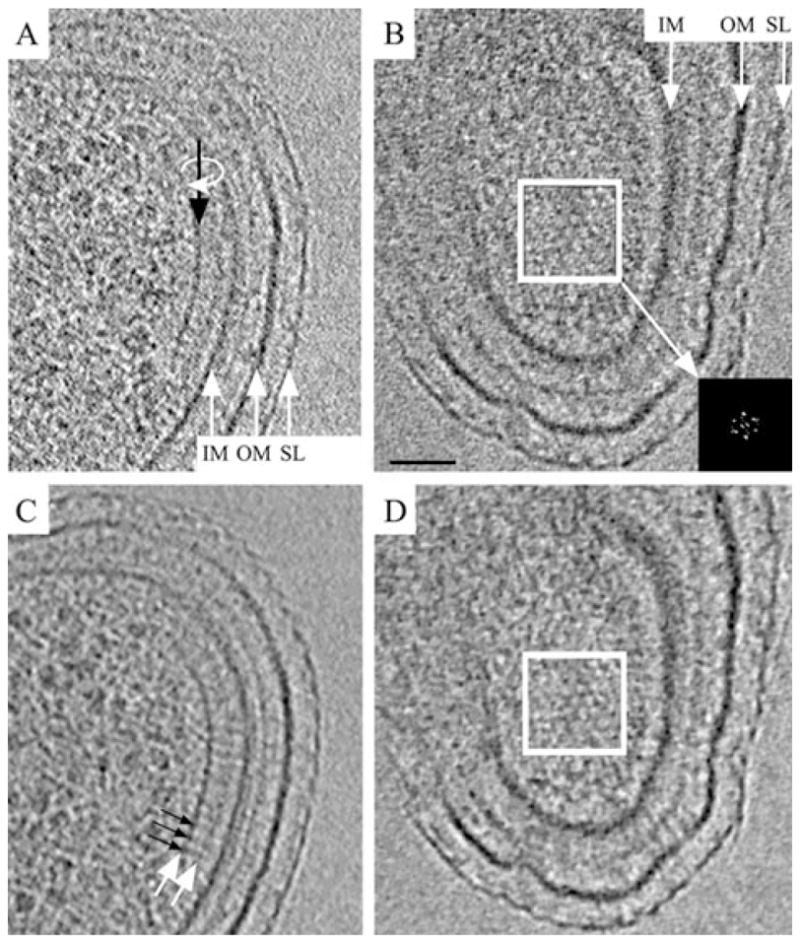
Structure of a wild-type chemoreceptor array.
A and B. 8 nm thick tomographic slices perpendicular (A) and parallel (B) to the membranes (the slice shown in B is related to that shown in A by a 90° rotation around the line indicated by the black arrow).
C and D. The same slices after median filtering. The base plate (left white arrow in C) is positioned 31 nm proximal to the inner membrane (IM, inner membrane; OM, outer membrane; SL, surface layer). Thin pillars of density (black arrows in C) connect the base plate with the inner membrane, and a second, fainter, plate-like layer (right white arrow in C) is visible between the base plate and inner membrane. The hexagonal arrangement of the chemoreceptor array right above the base plate is apparent in (B) and (D) (white box). The power spectrum (inset, enlarged to enhance clarity) reveals a lattice with a centre-to-centre spacing of 12 nm. Scale bar: 50 nm.