Figure 3.
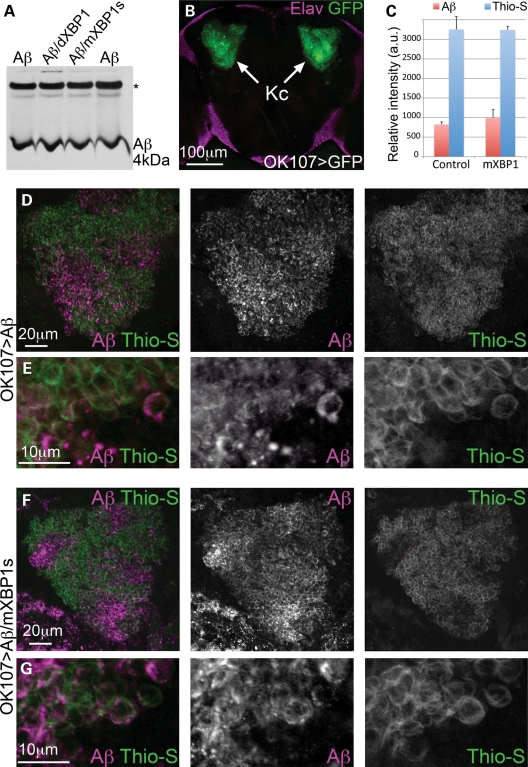
XBP1 does not affect Aβ accumulation in brain neurons. (A) Western blot shows total Aβ accumulation in Drosophila brains expressing Aβ alone (lanes 1 and 4) or co-expressing dXBP1 (lane 2) or mXBP1s (lane 3). Levels of total Aβ are the same in the three conditions. *Indicates an unspecific band. (B) Z-axis projection of a 20 µm optical section of the posterior brain of Drosophila showing accumulation of GFP in the Kenyon cells (arrows, OK107-Gal4/CD8–GFP). The cortex was labeled with anti-Elav (magenta) to include the outline of the brain. (C) Quantification of fluorescent signal for Aβ and thioflavine-S in (D) and (F). The co-expression of mXBP1s did not significantly change the levels of Aβ (red bars) or thioflavine-S (blue bars). (D and F) Detail of the Kenyon cells showing total Aβ expression (magenta) and thioflavine-S fluorescence (green) in flies only expressing Aβ (D) or co-expressing mXBP1s (F). (E and G) At higher magnification, neither the distribution of Aβ (magenta) nor the intensity of thioflavine-S fluorescence (green) is affected by mXBP1 co-expression.

