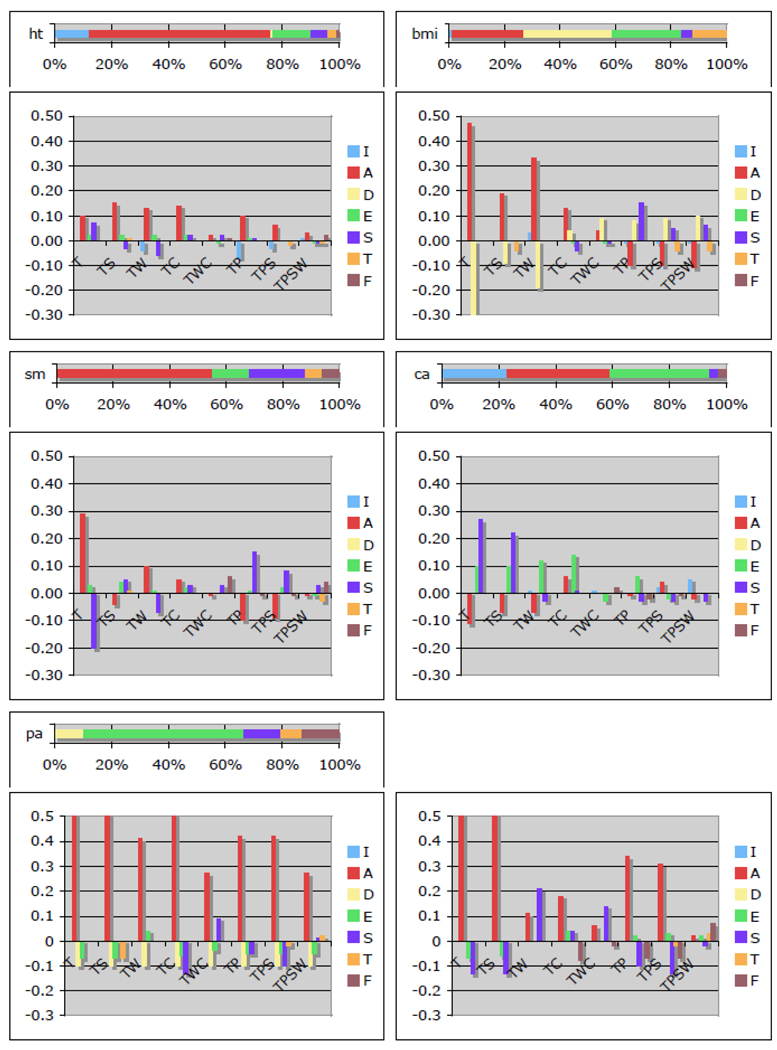
Figure 1.
Discrepancies in estimates of variance components compared to those of the cascade model (top graph) by type of relative included in the design and source of variance.
[ht: height, bmi: body mass index, sm: smoking status, ca: church attendance, pa: political affiliation; relative types and their combinations: T: twins, S: sibings, W: spouses, C: children, P: parents sources of variance: I: genetic variance due to assortment, A: additive genetic variance, D: dominance, E: unique environmental variance, S: sibing environmental variance, T: twin environmental variance, F: cultural transmission]

