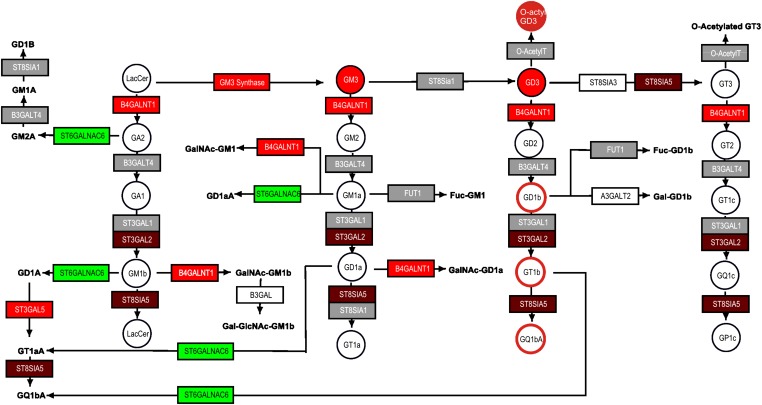
Fig. 6.
Comparison of microarray data and metabolites for ganglioside biosynthesis for invasive ductal breast carcinoma and normal ductal tissue. Gene expression differences between the two breast cancer stages were visualized using data from a previous study (43) and updated ganglioside biosynthetic maps in PathVisio v2 (18). Ganglioside measurements are from reports using similar tumors (circles with a solid shade) (49) and patient serum (circles with colored edges) (15). The color scale for the difference between MDA-MB-231/MCF7 cells is the same as in Fig. 1.

