Fig. 2.
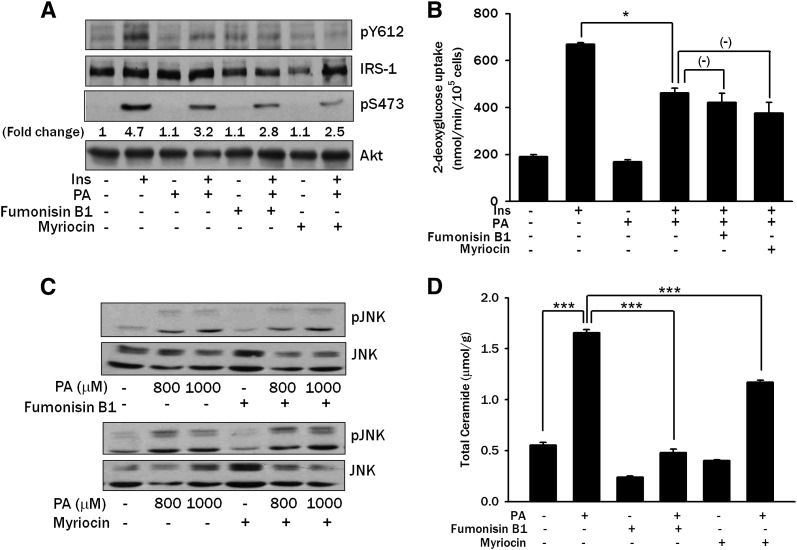
Effect of ceramide synthesis inhibitors on PA-induced insulin resistance. A: L6 myotubes were pretreated with 20 μM Fumonisin B1 or 500 nM Myriocin for 1 h, then incubated with 800 μM PA for 14 h. Subsequently, L6 myotubes were treated with 100 nM insulin for 15 min, followed by Western blot analysis to determine phosphorylation of IRS-1 Tyr612 and Akt Ser473 using specific antibodies. Fold changes of the intensities of phospho-Akt Ser473 bands assessed by densitometry are shown. B: L6 myotubes were treated with 800 μM PA for 14 h after pretreatment with 20 μM Fumonisin B1 or 500 nM Myriocin for 1 h. During the last 30 min, myotubes were treated with 100 nM insulin, and uptake of 2-deoxyglucose was measured as in Fig. 1B. C: L6 myotubes were pretreated with 20 μM Fumonisin B1 or 500 nM Myriocin for 1 h, then incubated with PA for 12 h. Western blotting was done to evaluate JNK phosphorylation using a specific antibody. D: L6 myotubes were pretreated with Fumonisin B1 or Myriocin, then incubated with PA as in C. After lipid extraction, ceramide content was measured by LC-MS/MS as described in Materials and Methods. The values (means ± SE) are representative of two or three independent experiments performed in triplicate showing similar tendencies. Western blots are representative of four independent experiments showing similar features. *P < 0.05; ***P < 0.005.

