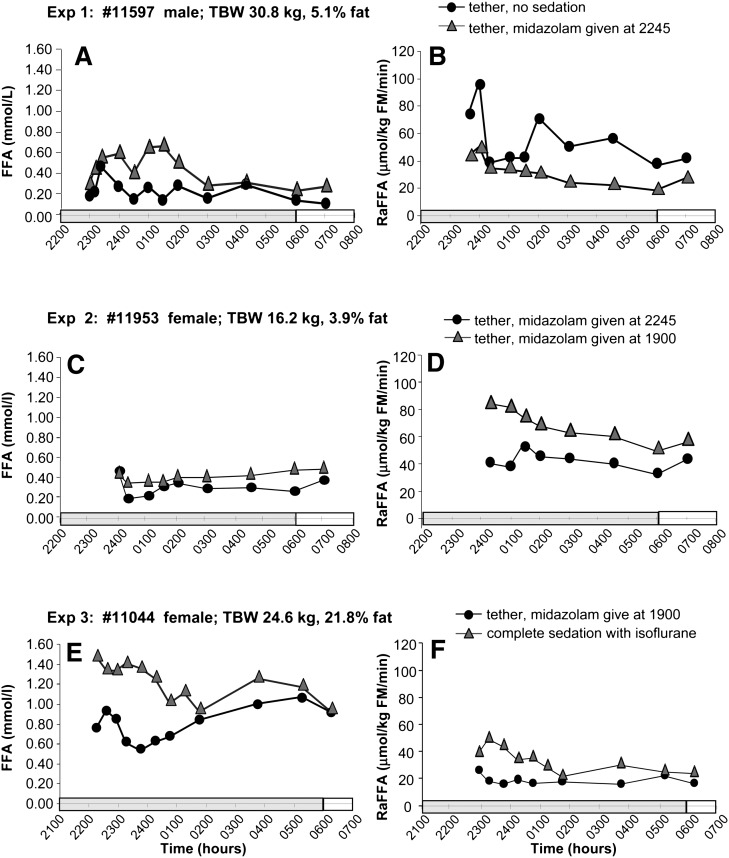
Fig. 2.
Effects with or without midazolam treatment and complete/no sedation. Data are presented for 3 animals with nighttime plasma FFA concentrations in the graphs on the left (A, C, E) and FFA turnover rates in the graphs on the right (B, D, F). See Table 1 for details of interpretation.

