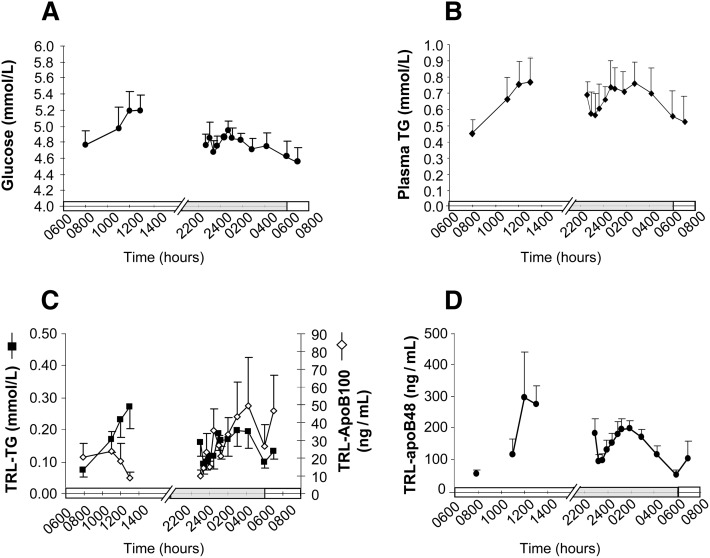
Fig. 3.
Concentrations of plasma glucose, total plasma-TG, TRL-TG, TRL-apoB100, and TRL-apoB48 during the 24h study. Data represent the means ± SEM for animals in Part 2 (n = 7): (A) glucose, (B) plasma-TG, (C) TRL-apoB100, and TRL-TG, and (D) TRL-apoB48. X-axis bars denote the light cycle (0600 to 1800 h) and the dark cycle (1800 to 0600 h) in the animal room.

