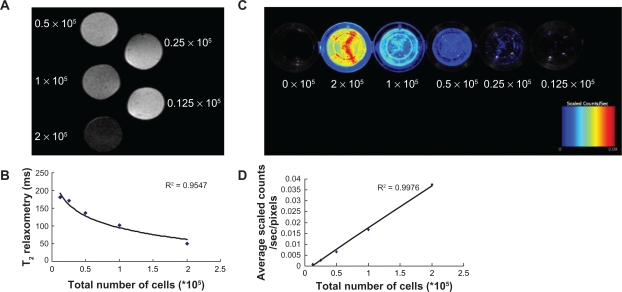
Figure 2.
In vitro correlations between MR T2 relaxometry or NIR fluorescent signal and the number of cells. A) A phantom of 2 × 10⁵ cells appeared black, whereas a phantom of 0.125 × 10⁵ cells appeared gray in the MR images. B) A strong correlation between the number of cells and T2 relaxometry was observed (R2 = 0.9547). C) Fluorescent images showed that signal intensity increased with the increasing cell number. Bars represent maximum radiance. D) Correlation plot showed fluorescence counts correlated linearly with cell number (y = −0.002 + 0.02 x; R2 = 0.9976).
Abbreviations: MR, magnetic resonance; NIR, near-infrared.

