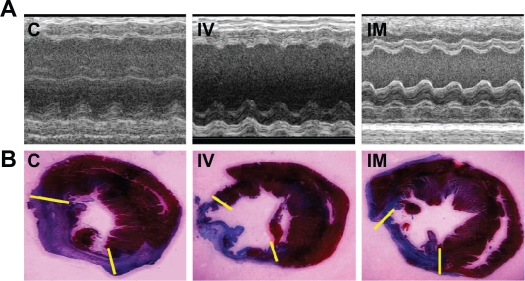
Figure 3.
Measurements of cardiac function and infarct size. A) Representative M-mode images at the level of papillary muscles were recorded among three groups. B) Representative Masson’s trichrome-stained histological sections to measure infarct size. Collagen presented blue but myocardium appeared red. Infarct size was quantified as the area occupied by collagen (blue; yellow hash marks).
Abbreviations: C, control group; IV, intravenous group; IM, intramyocardial group.

