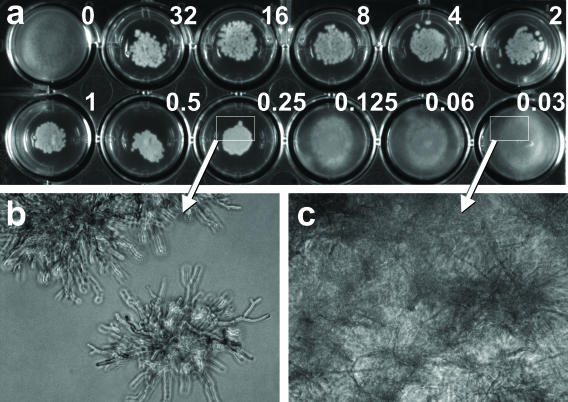
FIG. 1.
Agar dilution method. (a) Well 1 is a positive control (without CAS), and wells 2 to 12 contain drug concentrations ranging from 32 to 0.03 μg/ml (as shown). The MIC is 0.25 μg/ml, interpreted as the lowest drug concentration showing compact granular microcolonies compared to the radial filamentous colonies of the growth control and wells containing lower drug concentrations (0.125 to 0.03 μg/ml). The corresponding microscopic appearance of colonies at effective concentrations and subinhibitory concentrations of drug are shown in panels b and c, respectively.

