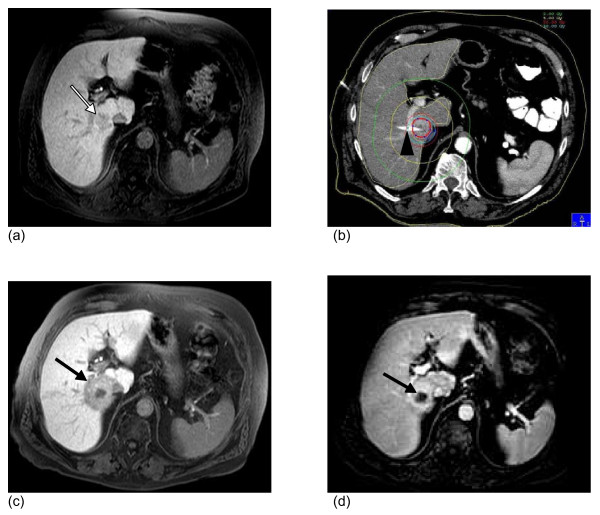
Figure 1.
Illustration of CT guided brachytherapy and post interventional hepatic dysfunction in MRI. (a) Baseline MRI. T1-w GRE 20 minutes post i.v. application of Gd-EOB-DTPA. Colorectal liver metastasis in segment 6/7 (white arrow). (b) Contrast-enhanced computed tomography (CT) after CT-guided positioning of one brachytherapy catheter (truncated, black arrowhead) in the metastasis. The red line resembles the 15Gy isodose. (c) MRI 6 weeks after treatment. T1-w GRE 20 minutes post i.v. application of Gd-EOB-DTPA. Signal void around the tumor indicates hepatocyte dysfunction of liver parenchyma (black arrow). No evidence of tumor regrowth in (d): T1-w GRE dynamic scan 60s after application of the contrast dye shows shrinkage resulting from tumor necrosis after irradiation (black arrow).

