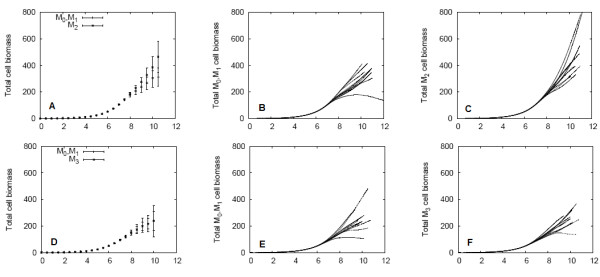
Figure 6.

Biomass of QS and M2 and M3 non-QS colonies in mixed biofilms. High nutrient case, EPS consumption excluded. Figure (A) shows the average biomass and standard deviation for the ten M2-mixed simulations; and total M0 + M1 (B) and M2 (C) cell biomass for each individual simulation are shown as well. Similarly, the results for the ten M3-mixed biofilms are shown in (D)-(F).
