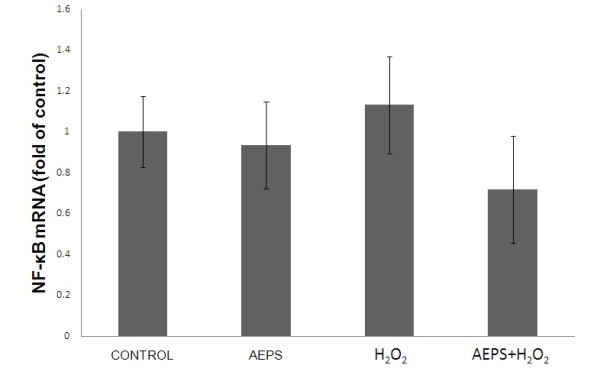
Figure 2.

NF-κB mRNA expression in HUVECs. Figure 2 represents the bar chart showing NF-κB mRNA expression in control, AEPS, H2O2 and AEPS + H2O2 groups. Both AEPS and H2O2 did not cause significant changes in NF-κB mRNA expression in HUVEC. Values are means ± SEM of n = 6.
