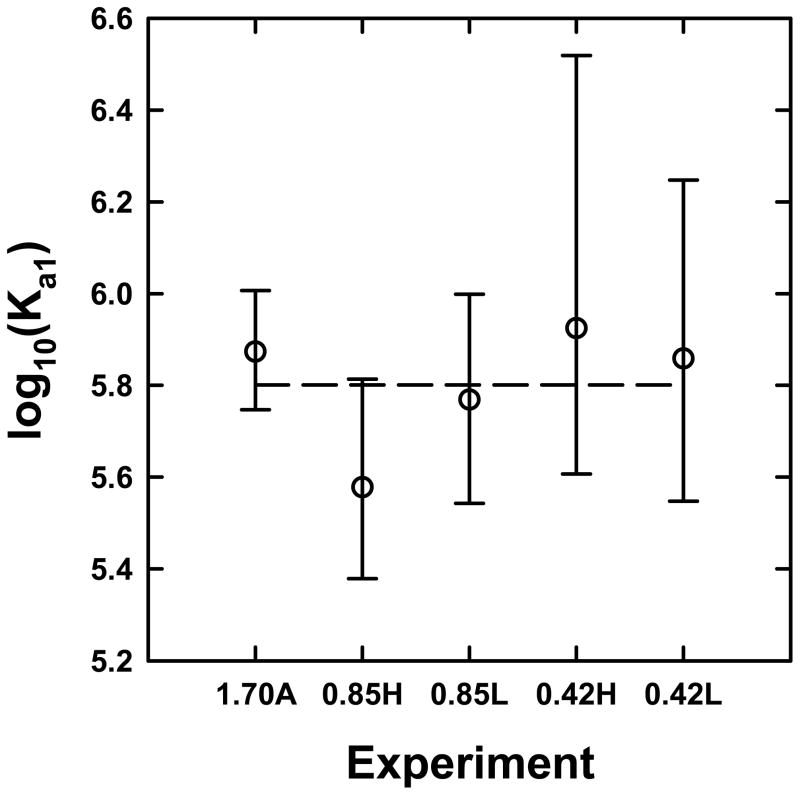
Figure 4. Sedimentation equilibrium analyses are robust and precise.
(A) Values of log10(Ka1) obtained for various data sets corresponding to STI and α-chymotrypsin loading concentrations of - (1.70A) 0.7, 1.3, 2.0, 2.0, 4.0, 8.0 μM STI and 1.7 equivalents of α-chymotrypsin, (0.85H) 2.7, 5.1, 10.2 μM STI and 0.85 equivalents of α-chymotrypsin, (0.85L) 0.7, 1.4, 2.7 μM STI and 0.85 equivalents of α-chymotrypsin, (0.42H) 3.7, 6.8, 13.7 μM STI and 0.42 equivalents of α-chymotrypsin, (0.42L) 0.9, 1.8, 3.7 μM STI and 0.42 equivalents of α-chymotrypsin. STI concentrations were allowed to float but the STI:α-chymotrypsin ratio was fixed. The error bars represent the 95% confidence limits of log10(Ka1) and the dashed line represents the average value of log10(Ka1).

