Abstract
Atomic force microscopy (AFM) was used to assess a new chimeric protein consisting of a fusion protein of the consensus repeat for Nephila clavipes spider dragline protein and bone sialoprotein (6mer+BSP). The elastic modulus of this protein in film form was assessed through force curves, and film surface roughness was also determined. The results showed a significant difference between the elastic modulus of the chimeric silk protein, 6mer+BSP, and control films consisting of only the silk component (6mer). The behaviour of the 6mer+BSP and 6mer proteins in aqueous solution in the presence of calcium (Ca) ions was also assessed to determine interactions between the inorganic and organic components related to bone interactions, anchoring and biomaterial network formation. The results demonstrated the formation of protein networks in the presence of Ca2+ ions, characteristics that may be important in the context of controlling materials assembly and properties related to bone-formation with this new chimeric silk-BSP protein.
Keywords: Atomic force microscope, chimeric proteins, silk, mechanical properties, calcium mediated networks, bone regeneration
1. Introduction
With the potential importance of tissue engineering in healthcare the design of new biopolymers with improved mechanical and biocompatibility characteristics has become a major goal in the field of biomaterials research. Spider dragline silk fibers exhibit remarkable viscoelastic properties, combining a tensile strength similar to steel and Kevlar with a high elasticity that is comparable to rubber1. In part these mechanical properties are a consequence of the amino acid chemistry where the hydrophilic GGX motif (G stands for glycine, X is mostly glutamine) alternates with poly-alanine (poly-A) motifs2. The GGX motif adopts a helical conformation forming an amorphous region that connects the poly-A motifs, providing elasticity to the silk fiber. The hydrophobic poly-A motifs are responsible for the formation of rigid and highly packed anti-parallel βsheets3 resulting from hydrogen bonding and hydrophobic interactions4. The remarkable mechanical properties together with the inherent biocompatibility suggest spider silk as a promising biopolymer for bone repairs and bone growth5. Recently, a spidroin protein inspired by dragline silk from Euprosthenops australis was expressed in Escherichia coli and used to produce meter-long fibers with a tensile strength of approximately 0.2 GPa, which is above the values for mammalian bone and tendon6, 7, and a elastic modulus of 7 GPa, comparable to native dragline from Nephila clavipes8. Furthermore, in vitro tests with HEK 293 cells indicated that these fibers were biocompatible and capable of sustaining cell attachment and growth8.
Recombinant spider silk offers advantages over natural spider silk. With recombinant DNA technology the protein amino acid sequence and length can be controlled to tailor the sequence chemistry and polymer features to the target needs in terms of structure and functional features9, 10. Our previous work11 described the synthesis of a new chimeric protein through the fusion of a spider silk (6mer) with six repeats of the consensus amino acid block from the native sequence of the major ampullate dragline silk I protein, MaSpI, from the spider specie Nephila clavipes, with bone sialoprotein sequence (BSP) designated by 6mer+BSP (Figure 1). BSP is a noncollageneous protein present in bone tissue that can induce the deposition of calcium phosphate in the form of hydroxyapatite and bind to collagen fibers12. At the cellular level BSP induces the attachment and differentiation of osteoblasts13 and stimulates osteoclast activity14, thereby playing an important part in the remodelling process of bone. In previous work we demonstrated that the fusion protein 6mer+BSP maintains the ability to induce the deposition of calcium phosphate, due to the presence of the BSP domain11.
Figure 1.
Amino acid sequence for the 6mer+BSP protein. The linkers for the BSP sequence are underlined. The 6mer is represented in black and the BSP sequence is represented in gray.
In the present study atomic force microscopy (AFM) was used to collect topographic images of 6mer and 6mer+BSP films, to measure surface roughness of these films and to assess the elasticity of the films, since AFM can also be used to determine local mechanical properties of soft polymeric samples15. The AFM tip is used to indent the sample resulting in a force curve that can be analyzed for elastic response of the sample to the small loading force applied by the tip15. The Hertz model for elastic indentations can be used to calculate Young’s modulus (E)16. Previous studies have used AFM to measure the elastic properties of spider silk either by stretching a spider silk fiber attached to the AFM tip9 or by indentation into the fiber16. In the present work, AFM was used to assess the elasticity of 6mer+BSP films vs. the controls.
Since 6mer+BSP was synthesized for bone-related biomaterial needs, the behaviour of 6mer+BSP in the presence of divalent Ca2+ was also assessed with AFM imaging. The deposition of calcium phosphate induced by BSP is related to the negatively charged polyglutamic sequences that interact with positively charged Ca2+ ions 17, 18. The binding with Ca2+ ions was important in the formation of Ca mediated networks of osteopontin proteins, increasing the ability of these networks to dissipate energy in response to applied forces, contributing to bone plasticity19. The study of 6mer+BSP in the presence of Ca2+ ions is important to gain insight into how these types of molecules form Ca mediated networks related to bone regeneration. The presence of these types of Ca-BSP networks fully integrated with a robust silk biomaterial could be useful both in osteointegration as well as for structural support.
2. Materials and Methods
2.1. Cloning and protein expression
The clone carrying the DNA sequence coding for BSP was purchased from the Harvard clone collection (Clone Identification: HsCD00082642, “The ORFeome Collaboration” Dana-Farber/Harvard Cancer Center, Boston, MA, USA) and inserted in the vector pET30L (Novagen, San Diego, CA, USA) carrying the silk block copolymer10, as we have described previously11. The 6mer+BSP protein was expressed in E. coli RY-3041 strain grown in Hyper Broth™ (0107-S, Athens Enzyme Systems, Baltimore, MD, USA) to an OD600 of 1 in the presence of kanamycin 25 μg/ml. Expression was induced with isopropyl β-D-thiogalactoside (IPTG, 15529019, Invitrogen, Carlsbad, CA, USA) 0.5 mM. The cells were harvested by centrifugation and cell pellet was lysed under denaturating conditions using the buffer 100 mM NaH2PO4, 10 mM Tris HCl, 8 M urea (pH 8.0). Insoluble cell debris was excluded from the mixture by centrifugation and the supernatant was collected. After incubating the supernatant with Ni-NTA resin (30250, Qiagen, Valencia, CA, USA) for two hours, the mixture was loaded in a column and washed several times with denaturating buffer at pH 8 and at pH 6.0. Protein was eluted using denaturating buffer at pH 4.5. Protein solution was loaded into snake skin membranes (131054, Spectra/por Biotech, Rancho Dominguez, CA, USA) and dialysed against 20 mM sodium acetate buffer (pH 4.75) followed by dialysis in MQ water. Finally protein solution was lyophilized in a LabConco (Kansas city, MO, USA) lyophilizer.
2.2. Sample preparation
The 6mer+BSP and 6mer protein (silk control) were dissolved in MQ water to a final concentration of 2% (m/v). Then 20 μl of protein solution was cast onto freshly cleaved mica surfaces and left to dry at room temperature. After drying the protein films were treated with 70% methanol solution for two hours to induce the transition of secondary structure from random coil to β-sheet, providing stability in aqueous solutions. A total of three protein films were used to collect force curves. To study the formation of protein networks, the 6mer+BSP and 6mer proteins were dissolved in three different solutions: 4-(2-hydroxyethyl)-1-piperazineethanesulfonic acid (HEPES, pH 7.4) 0.1 mM buffer, HEPES 0.1 mM buffer containing magnesium (Mg+2) ions in a molar ratio of 1:1000 (protein:Mg) and HEPES 0.1 mM buffer containing Ca2+ ions in a molar ratio of 1:1000 (protein:Ca) 20. The final protein concentration was 0.01 mg/ml. Protein solution was deposited onto a freshly cleaved mica surfaces and left to dry at room temperature.
2.3. AFM imaging and force spectroscopy
An AFM (Veeco Dimension V 3100 Scanning Probe Microscope, NY, USA) with a scanning range of 90 μm2 and a z range of 7–8 μm was used for imaging and force-curve measurements. AFM cantilevers (Veeco, FESP) made of silicon with a spring constant of 3.152 N/m were used and AFM imaging and force-curve measurements were performed in the dry mode. A total of 100 force curves were recorded for both 6mer+BSP and 6mer films, respectively, using the software NanoScope V (Veeco). Mica was used as a control. Force curves were collected using contact mode AFM. Samples were imaged with tapping mode AFM. The tapping mode operation allowed the visualization of weakly adsorbed samples by eliminating the lateral forces between the probe tip and the sample21. The heights of the structures imaged on mica were determined by section analysis using Nanoscope image analysis software. Roughness measurements were performed with the NanoScope V (Veeco). Two values were measured: the root mean square (RMS) and the arithmetic average height (Ra). RMS represents the standard deviation of the height values within a given area and allows the surface roughness to be determined by statistical methods22, 23. Ra is the most frequently used roughness parameter and is defined as the average deviation of the roughness irregularities from the mean line over one sampling length22, 23. Because roughness values change with the scan size the measurements were performed using three different scan windows: 20 × 20 μm2, 10 × 10 μm2 and 2 × 2 μm2.
2.4. Analysis of the data from the force curve measurements
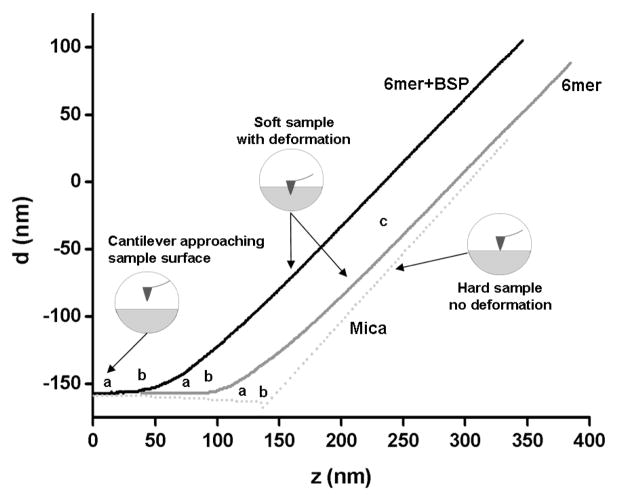
In a force curve, the cantilever deflection (d) is registered as a function of its vertical position (z) [equation 1 (Eq. 1)]. The slope of the force curve gives a qualitative idea of the sample elastic properties. For a stiff sample the force curve is characterized by a flat area when the tip is approaching the sample and by a slope region where the cantilever deflection is identical to the z movement, d = z 15, 16. However, in the case of a soft sample this slope region becomes shallower as a result of the decrease in the deflection value due to elastic indentation (δ),
| (Eq. 1) |
Hooke’s law relates the deflection with the applied force through the force constant of the cantilever (k)
| (Eq. 2) |
The Hertz model relates the indentation δ with the loading force F and by using the Sneddon modification24, 25 we have
| (Eq. 3) |
where E is the elastic or Young’s modulus, v is the Poisson ration of the sample, assumed to be 0.5 for incompressible materials26, and α is the opening angle of the AFM tip. By combining equations 2 and 3 we have
| (Eq. 4) |
Whit the rearrangement of equation 3 we have an expression for indentation δ
| (Eq. 5) |
Since δ can not be detected directly by AFM it can be replaced by combining equations 1 and 5 27
| (Eq. 6) |
For data treatment we will use the more general form
| (Eq. 7) |
d0 and z0 are the initial values of deflection and height, respectively28.
Equation 7 was used to fit the date from the recorded force curves and to calculate the value of the elastic modulus, E, for the 6mer+BSP and 6mer films.
2.5. Secondary structure analysis
Since β-sheet and random coli/helix content are considered major factors related to the mechanical properties of spider silk materials, Attenuated-Total Reflectance Fourier Transform Infrared Spectroscopy (ATR-FTIR) was performed to assess the secondary conformation of both the 6mer and 6mer+BSP proteins. These data provide structural details to support the interpretation of mechanical properties from the AFM studies, including the differences between the calculated Young’s modulus for the 6mer and 6mer+BSP films. ATR-FTIR measurements were performed with the 6mer and 6mer+BSP films, prepared as mentioned in section 2.2, using a Jasco model FT/IR-6200 type A equipment (Jasco Inc. MD, USA). Spectra were collected in absorption mode at 8 cm−1 resolution using 64 scans in the spectral range 4000 to 400 cm−1. The quantification of secondary structure was based on the analysis of the amide I region (1700 to 1600 cm−1) and was determined through the deconvolution of the spectra followed by the normalization of the obtained values to the total area of the amide I region29. Briefly, OPUS deconvolution software (Bruker optics, Billerica, MA, USA) was used for spectra deconvolution. Following deconvolution the spectra were curve-fitted with Gaussian bands using the peak pick function and the information concerning the percentage of amide I and II regions, bandwidth and band position, referring to β–sheet or α-helix conformations, can be obtained30.
2.6. Circular dichroism
Circular dichroism (CD) spectroscopy was performed with an Aviv, Model 410 (Biomedical, Inc. NJ USA) equipment. The spectra were collected between 260 and 180 nm with a step size of 1 nm, an averaging time of 1s. A total of five scans were collected in three different samples for each condition. A baseline spectrum was subtracted from the samples. Cells of 0.1 cm path length were used and measurements were performed with 1 mg/ml protein solutions in 0.1 mM HEPES buffer (pH 7.4) and in 0.1 mM HEPES containing Ca2+ ions in a molar ratio of 1:1000 (protein:Ca), as mentioned in section 2.2. The procedure was repeated in the presence of Mg2+ ions, 0.1 mM HEPES containing Mg2+ ions in a molar ratio of 1:1000 (protein:Mg). CD provided a check to determine if there were any differences in secondary conformation of the 6mer+BSP and 6mer when in a buffer solution with pH of 7.4 in the presence of Ca2+ or Mg2+ ions.
2.7. Statistical analysis
Statistical analysis was performed with SPSS 17.0. Shapiro-Wilk test was use to test for the normality of the data. Because the data had no normal distribution, the nonparametric Mann-Whitney test was used to test for significant differences. In the case of data with normal distribution the parametric test t was used. Statistical significance was defined as p<0.05.
3. Results
3.1. Force curves and Young’s modulus (E) calculations
Figure 2 shows the force curves for the 6mer and 6mer+BSP films and on a hard sample control, mica. By comparing the slope regions the elastic modulus (E) was calculated using the d and z values extracted from the force curves collected using equation 7 (2.4. Materials and Methods section). The E values for both the 6mer and 6mer+BSP films were 1.1±0.6 GPa and 1.5±0.6 GPa, respectively, and were calculated based on the force curves collected for at least 100 different points in each protein film. Statistical analysis indicated that the Young’s modulus value calculated for the 6mer film was significantly lower than the value obtained for the 6mer+BSP film (p<0.05). E values were calculated by averaging over all points where the force curves were collected.
Figure 2.
Force curves on 6mer and 6mer+BSP films, and on mica: a) cantilever approaching the surface; b) contact point; c) cantilever in contact with the surface.
3.2. Secondary structure analysis
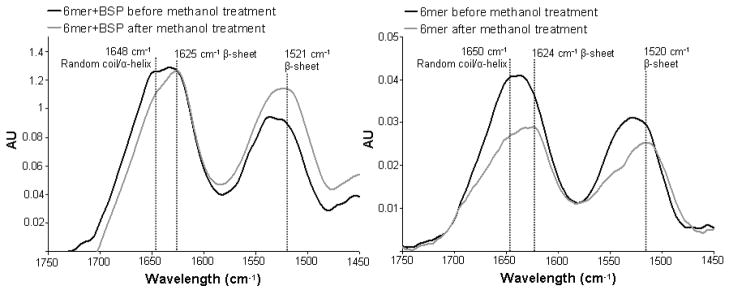
For both the protein films, 6mer control and 6mer+BSP, ATR-FTIR spectra revealed no major differences between secondary structures. For both proteins two peaks were observed, at 1624 and 1520 cm−1, indicative of an antiparallel β-sheet conformation, and a third peak was found at 1650 cm−1 corresponding to a helix/random coil conformation2, 10, 31 (Figure 3). Spectral deconvolution indicated that both proteins had similar percentages of β-sheet and helix/random coil (Table 1) and statistical analysis indicated no significant difference (p>0.05).
Figure 3.
ATR-FTIR spectra of the 6mer and 6mer+BSP films after 2 hours of treatment with 70% methanol.
Table 1.
Percentage of β-sheet and helix/random coil for 6mer control and 6mer+BSP films after methanol treatment.
| Sample | β-sheet | Random coil/α-helix |
|---|---|---|
| 6mer | 34.5±6 | 31.3±7 |
| 6mer+BSP | 34.3±3 | 33.4±9 |
3.3. Roughness measurements
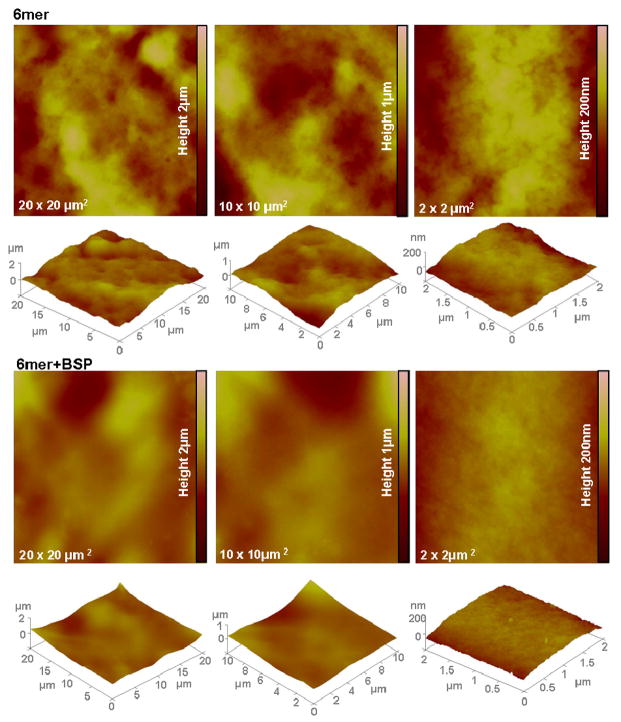
Figure 4 shows representative surface topographies from AFM images of the 6mer and 6mer+BSP films, used for the calculation of the roughness values RMS and Ra. RMS and Ra values were similar for the 6mer and 6mer+BSP films (Table 2) and statistical comparison indicated no significant difference (p>0.05). The RMS value for blank mica using the scan sizes of 20 × 20 μm2, 10 × 10 μm2, 2 × 2 μm2 were 0.881, 0.455 and 0.085 nm, respectively. For Ra these values were 0.712, 0.377 and 0.067 nm for 20 x 20 μm2, 10 × 10 μm2 and 2 × 2 μm2 scan sizes, respectively.
Figure 4.
Topographies of AFM images (tapping mode) for 2% 6mer and 6mer+BSP films using 20 × 20 μm2, 10 × 10 μm2 and 2 × 2 μm2 scan sizes.
Table 2.
Surface roughness, RMS and Ra for the 6mer and 6mer+BSP films using different scan sizes.
| 6mer | 6mer+BSP | Mica | ||||
|---|---|---|---|---|---|---|
| RMS(nm) | Ra(nm) | RMS(nm) | Ra(nm) | RMS(nm) | Ra(nm) | |
| 20 × 20μm2 scan size | 252.8±43.2 | 194.2±32.0 | 249.4±70.4 | 201.8±61.4 | 0.881 | 0.712 |
| 10 × 10μm2 scan size | 124.4±11 | 99.6±8.8 | 144.8±79.1 | 115.1±63.0 | 0.455 | 0.377 |
| 2 × 2μm2 scan size | 23±5.1 | 18.3±4.8 | 14.6±6.0 | 12.2±5.5 | 0.084 | 0.066 |
RMS - root mean square; Ra - arithmetic average height
3.4. AFM imaging
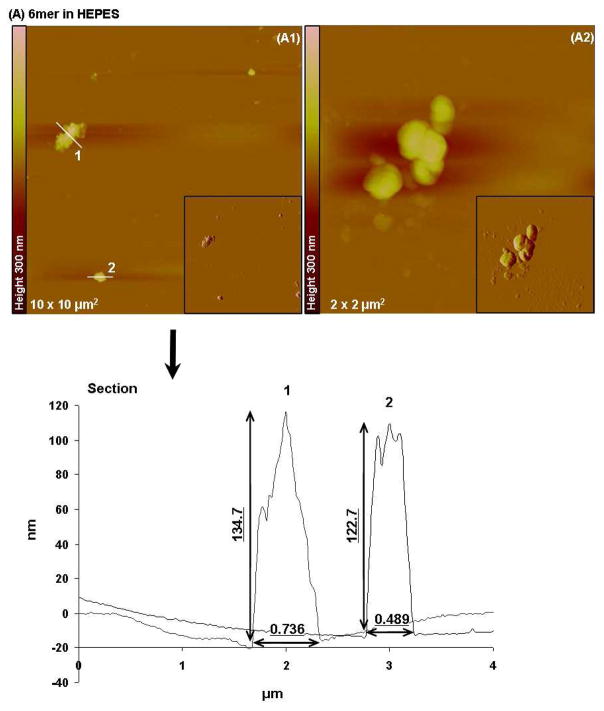
Tapping mode AFM imaging showed that when dissolved in HEPES 0.1 mM (pH 7.4) most of the 6mer appeared as large globular, amorphous protein aggregates (Figure 5A). The aggregates had different sizes, with diameters ranging from 0.489 to 0.736 μm and heights varying from 122.7 to 134.7 nm. Aggregates with similar morphology and size were also observed when the 6mer protein was dissolved in HEPES buffer containing Mg2+ ions in a molar ratio of 1:1000, protein:Mg (Figure 6A). However, after dissolving the 6mer protein in HEPES buffer containing Ca2+ ions in a molar ratio of 1:1000 (protein:Ca) the 6mer appeared more fibrous with a tendency to form fiber aggregates (Figure 7A). The cross-sections of these fibers or aggregates showed a width ranging from approximately 0.1 to 0.04 μm and a height between 2.6 and 5.8 nm.
Figure 5.
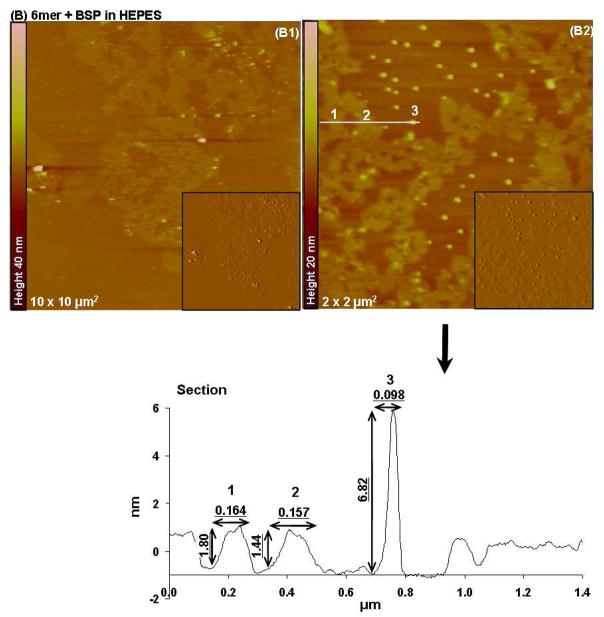
Topographies of AFM images (tapping mode) and corresponding section analysis of 6mer (A1–A2) and 6mer+BSP (B1–B2,) proteins in HEPES buffer 0.1 mM (pH 7.4).
Figure 6.
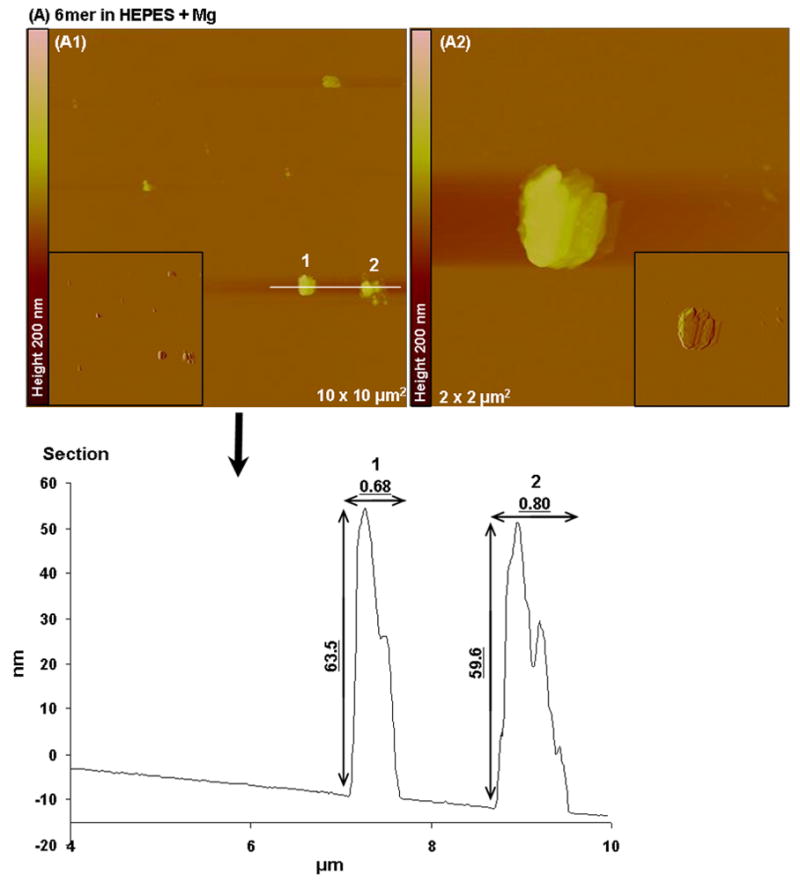
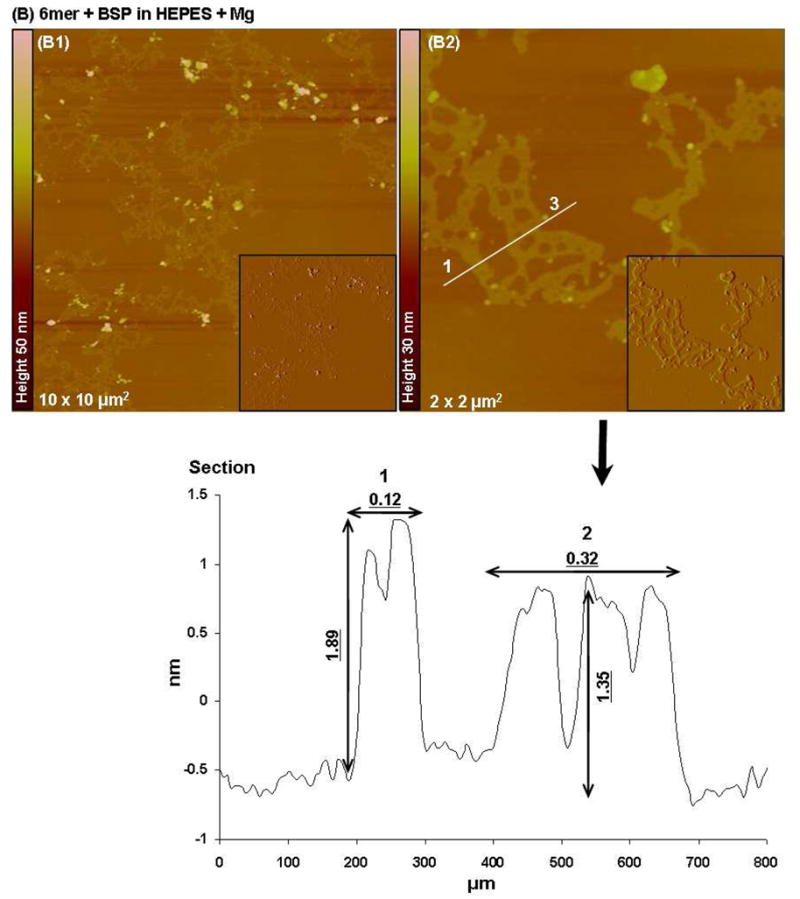
Topographies AFM images (tapping mode) and corresponding section analysis of 6mer (A1–A2) and 6mer+BSP (B1–B2) proteins in HEPES buffer 0.1 mM with Mg in a ratio of 1:1000 (protein:Mg).
Figure 7.
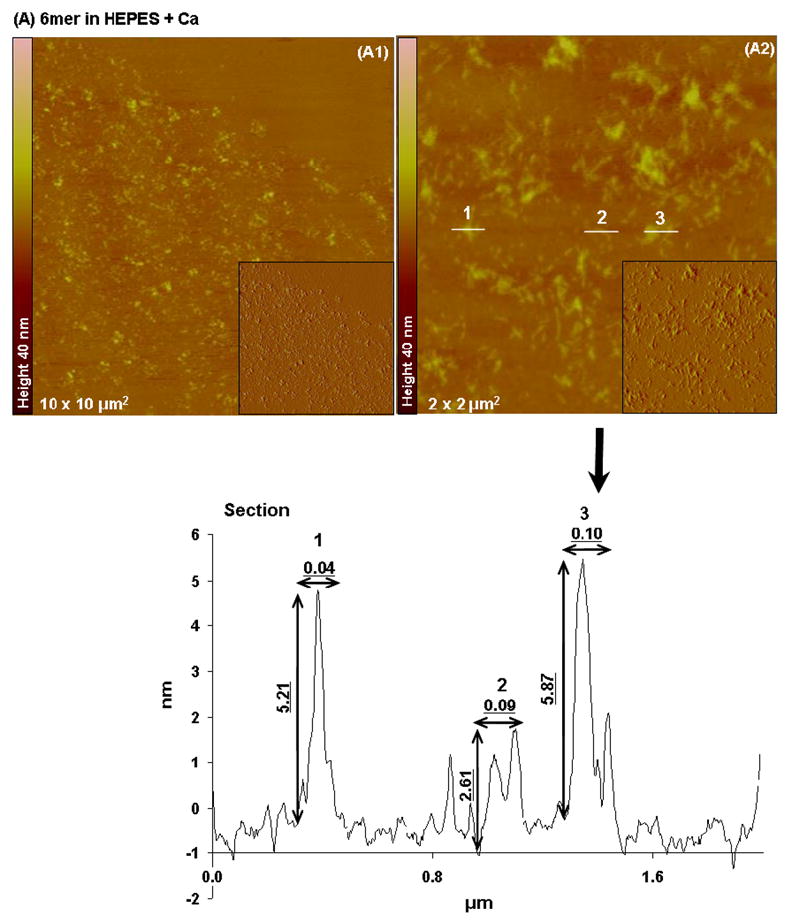
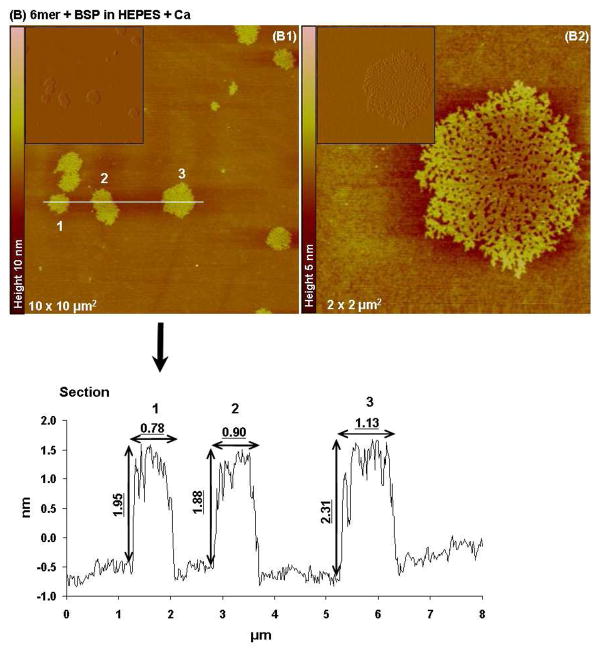
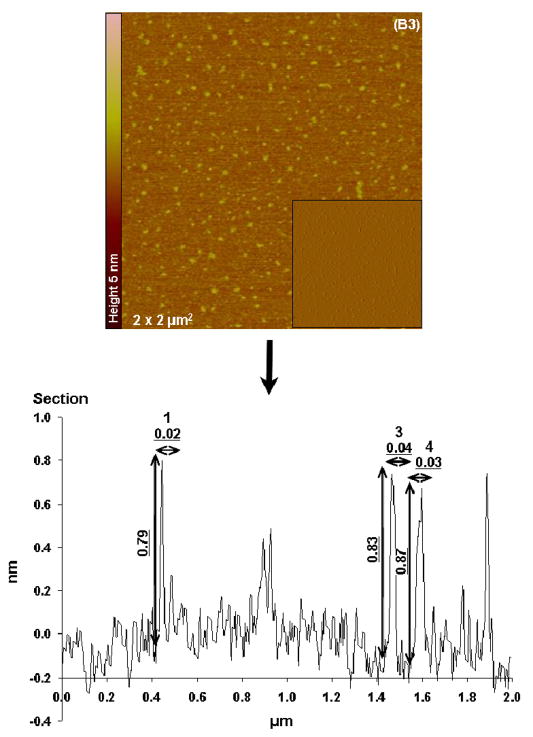
Topographies AFM images (tapping mode) and corresponding section analysis of 6mer (A1–A2) and 6mer+BSP (B1–B3) proteins in HEPES buffer 0.1 mM with Ca in a ratio of 1:1000 (protein:Ca).
In the case of the 6mer+BSP dissolved in HEPES, AFM imaging revealed two different forms of aggregates: elongated sheets forming large assemblies and spherical particles (Figure 5B). The sheets had heights between 1.4 and 1.8 nm. The second population of aggregates corresponding to spherical particles had heights between 6 and 7 nm (Figure 5B of 6.82 nm) and widths around 0.098 μm. Both types of aggregates had different shapes from those observed in the case of the 6mer protein dissolved in HEPES. Similarly to what happen with the 6mer protein, when the 6mer+BSP was dissolved in HEPES buffer containing Mg2+ ions the aggregates observed were similar to those obtained when dissolved in HEPES solution only. Once again large assemblies of elongated sheets were detected together with particles with an amorphous shape. These sheets had heights ranging between 1.89 and 1.35 nm, as observed for the HEPES solution (Figure 6B).
When the 6mer+BSP protein was dissolved in HEPES with Ca two distinct structures were observed, one corresponding to protein networks with different widths and another corresponding to individualized particles (monomers and dimmers). The widths for the aggregate networks varied, the smaller ones in Figure 7B1 have widths of around 0.2 nm and the largest ones corresponding to number 3 had diameters of 1.1 nm as seen in cross-sectional images. The height values for these structures were between 1.9 and 2.3 nm. The second population of structures corresponded to particles with diameters of 0.02 to 0.04 μm and heights of around 0.8 nm (see section for Figure 7B3). Once again the forms observed were different from those imaged with the 6mer protein and also different from those detected for the 6mer+BSP dissolved in HEPES and HEPES with Mg added.
3.5. CD analysis
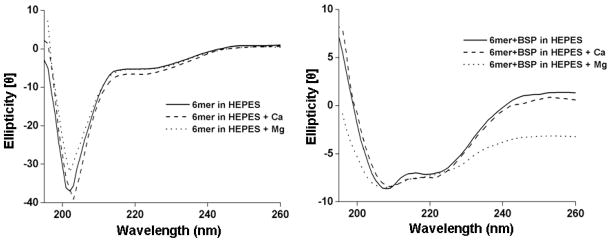
CD spectroscopy for the 6mer protein showed no apparent difference between the spectra collected for the protein dissolved in HEPES and that dissolved in HEPES with Ca or Mg added. For the three spectra a predominance of β-hairpin conformation (Figure 8) was found, characterized by a negative ellipticity with a minimum at approximately 202 nm32, 33. Also for the BSP+6mer protein no major differences were observed between the spectra collected in the presence of Ca or Mg and in HEPES. In the three spectra the presence of α-helix was observed, with two minima at 210 and 220 nm32, 33 (Figure 8).
Figure 8.
CD spectra for the 6mer and 6mer+BSP recombinant proteins dissolved in HEPES buffer 0.1 mM (pH 7.4), in HEPES buffer 0.1 mM with Ca in a ratio of 1:1000 (protein:Ca) and in HEPES buffer 0.1 mM with Mg in a ratio of 1:1000 (protein:Mg).
4. Discussion
In the present work the Young’s modulus was calculated for the 6mer control and 6mer+BSP films based in the force curves. The values for the Young’s modulus were 1.1±0.6 and 1.5±0.6 GPa for the 6mer and 6mer+BSP films, respectively, and statistical analysis showed a significant difference (p<0.05). This divergence may be due to the insertion of the BSP domain which could interfere with the ability of the silk to form β-strands, resulting in a change in assembly and thus in mechanical characteristics. However, ATR-FTIR analysis showed a similar presence of the β-sheet (1624 and 1520 cm−1) for both the 6mer and 6mer+BSP films, after treatment with methanol. Furthermore, with the deconvolution of ATR-FTIR spectra the percentage of β-sheet and random coil showed no statistical differences (p>0.05) between the 6mer and 6mer+BSP films.
An alternative explanation for the differences in mechanical properties determined by AFM could be the high content of the amino acid glutamic acid in the BSP domain17 of the 6mer+BSP protein. Mechanical studies performed on silkworm silk fibers treated with four different solvents (water, acetone, ethanol and isopropanol) showed that immersion in acetone, ethanol and isopropanol leads to an increase in stiffness when compared with water. In contrast, the immersion of fibers in water resulted in a decrease in tensile modulus of the fibers. These results were explained by the fact that water disrupts inter- and intra-molecular hydrogen bonding in the silk matrix. This disruption allows the molecules to move with greater freedom resulting in more flexible and elastic fibers34 with a consequent decrease of stiffness, which was also observed for other biopolymers such as chitosan in the presence of water 35. These hydrogen bonds occur between the amide hydrogen and carbonyl oxygen present in adjacent protein chains36. In the 6mer+BSP sequence the carboxyl groups present in the side chains of the glutamic acid residues constitutes an additional hydrogen donor increasing the number of hydrogen bonds occurring between protein chains. Different studies performed with poly-glutamic peptides demonstrate the ability of these molecules to form strong hydrogen bonds37, 38. The presence of several glutamic acid residues with carboxyl groups in their side chains in the BSP sequence may also contribute to an increase in the number hydrogen bonds in the 6mer+BSP proteins17. This gain in hydrogen bonding between 6mer+BSP proteins chains may be a reason for the higher stiffness observed for 6mer+BSP films when compared with 6mer films. As mentioned above, the increase in number of hydrogen bonds between silk chain segments, as a consequence of the treatment with organic solvents, resulted in an increase in elastic modulus values for silk39.
Furthermore, the values of 1.1±0.6 and 1.5±0.6 GPa obtained for the 6mer and 6mer+BSP films are close to the values obtained for silk fibroin films, 2.7 GPa40 but still far from the values of 20–22 GPa for stiffness attributed to the major ampullate dragline silk from the spider Nephila clavipes41. This difference indicates that there remains a lot to learn about processing and assembly of silk proteins related to functional properties. Finally, the elastic behaviour of a protein can also be assessed through AFM force spectroscopy by using the pulling mode. In this mode the cantilever tip is pressed against the molecules deposited on the slide, picking up one or more molecules, which are then stretched between the tip and the slide generating a force versus extension curve42. By pulling the protein chain it is possible to measure the force required to unfold domains or loops or to break these molecules. This technique has been applied to different proteins, including silk, showing that in case of elastic fibres the force increases slowly when the fiber is stretched until it reaches its elastic limit, meaning that the pulling force must be applied over larger extensions and increasing the area under the force-extension curve. In the case of stiff materials with small elastic strains, since the extension over which the pulling force must be exerted is smaller, the area under the force-extension curve is smaller43. In this way, AFM force spectroscopy either by pulling mode or by contact mode can be used to assess two different perspectives of the elastic behaviour of a material or protein fiber.
AFM was also used to provide topographic images and roughness for the 6mer and 6mer+BSP films. The topographic images show that the 6mer+BSP films had a smoother surface that the 6mer films, however, a statistical comparison showed no significant difference between. Furthermore, the roughness values indicated a relationship between this parameter and the size of the scanned area; an increase in the size of the scanned area resulted in an increase in roughness values. This phenomenon was observed for both the 6mer and 6mer+BSP films (Table 2). Similar results were obtained in other studies when measuring the roughness properties of different materials using AFM44–48. A possible reason for this result is the effect of tip geometry on the measurements of surface roughness. At small scan sizes, if the tip is larger than the features causing the surface texture the surface will appear flatter as a consequence of poor access to lower points on the surface, and the roughness values will be lower 48. With the increase of the scan size there is an increase of roughness values46. In this way, by changing the scan size it is possible to acquire different surface topographies, with different roughness values44. The characterization of material surface roughness at different length scales is important since biocompatibility of a material is dependent on material chemistry and physical features, as well as on surface roughness49. Studies indicate that different scales of roughness induce different cell responses. The use of osteoblast-like U-2 OS cells showed that surface roughness of ground titanium had a significant effect on the adhesion of the cells. Cell adhesion and spreading had better outcomes for a roughness of 0.15μm in comparison with smoother (0.05 and 0.07 μm) or rougher (0.33 and 1.20 μm) surfaces49. Moreover, other studies indicate that roughness is important in determining cell response as long as roughness can be sensed by cells, meaning that the distance between peaks should not exceed the ability of the cell to form focal attachments in two or more peaks, otherwise the cell will sense the surface as smooth50. However, in a study with MG63 cells focal contacts formed more rapidly on smooth nanotopographies than on rougher anodized surfaces51. Recently, osteoblasts were found to responded better, spreading and forming lamellipodia, to smoother surfaces at microscopic length scales and rougher surfaces at macroscopic length scales52. In the same study, results obtained with Staphylococcus epidermis indicated that colonization was more effective in surfaces with roughness at the microscopic level52. Since micrometer and nanometer scales affect different aspects of cell behaviour and different cell types react differently to surface topography51 it is important to study the surface roughness over a range of length scales53.
Finally, the behaviour of the 6mer+BSP protein in the presence of divalent ions, Ca2+ and Mg2+, was investigated. During the past few years the role of Ca2+ ion in the formation of protein networks has been studied due to the importance of these networks in mechanical properties. For example, the abalone shell is a good example of a composite material formed by calcium carbonate plates arranged between organic matrix layers of β-chitin and proteins named lustrins54. The organic layers are responsible for the remarkable properties of these natural composites43, 54, 55 acting as a organic adhesive holding the calcium carbonate plates together. Smoth and co-workers43 used AFM to carry out pulling experiments on freshly cleaved nacre surfaces and obtained force-extension curves with a saw-tooth pattern probably resultant from the repeated unfolding of molecules, such as lustrin A. This unfolding is the outcome of successive opening of folded or looped domains of long molecular chains. When the pulling force rises to a value close to that needed to break the molecule backbone a domain unfolds or a loop opens and the molecule needs to be pulled again until another domain unfolds or a loop opens. Only when all the domains are unfolded and loops opened does the molecule finally break43. Furthermore, when the applied force is relaxed the unfolded domains and open loops have the ability to reform acting as a self-healing mechanism43. These sacrificial bonds are believed to be the key for the outstanding mechanical properties of natural biocomposites43,56. Divalent ions like Ca2+ and Mg2+ are crucial for the formation of these sacrificial bonds since this mechanism relies in the formation of intra and inter-chain ionic bond cross-links. Nacre organic matrix is rich in acidic macromolecules in which carboxylate groups are strong Ca binders55 and are probably involved in the formation of sacrificial bonds. Other AFM studies performed with the cement tube of Phragmatopoma californica worms57 and with the cell wall of Cylindrotheca fusiformis diatom give similar results58.
Bone is also a good example of a natural biocomposite where the formation of Ca mediated sacrificial bonds and the presence of unfolded lengths are responsible for the stiffness and enhanced energy dissipation56, 59–63. The presence of many noncollagenous proteins in bone organic matrix such as bone sialoprotein and osteopontin, in the case of bone, and amelogenin64 in the case of dental enamel, with a high number of negatively charged groups are capable of binding together through the formation of Ca ionic bonds63. This organic matrix acts as glue embedding the mineralized collagen fibrils and is capable of dissipating energy through the rupture of sacrificial bonds and stretching molecules, preventing the formation of cracks and increasing the total energy needed to fracture the material, thereby contributing to the improved toughness60. As in the case of nacre, when the applied force is removed the sacrificial bonds reform allowing the bone to repair itself56.
Because it is still unclear which molecules are involved in the formation of these protein networks and what bonds are responsible for keeping them together some studies addressing the network forming behaviour of different proteins present in tooth and bone organic matrix have been published. Fincham and co-workers studied the self-assembly of a recombinant amelogenin protein and found that this protein was capable of forming supra-molecular aggregates which the authors suggest to be responsible for controlling the formation of enamel crystals64. More recently, a recombinant osteopontin protein was reported to form long aggregate networks and to dissipate large amounts of energy when its molecules were pulled by an AFM cantilever tip19. In the presence of Ca2+ ions the resistance of these protein networks to the pulling force increased considerably19. The same authors performed similar experiments with other proteins, namely BSP19 and dentin matrix protein65, and the same network-forming tendency was observed. As in the case of osteopontin the presence of Ca potentiated the network-forming behaviour.
In the present work one of the objectives was to study the behaviour of 6mer+BSP protein in the presence of Ca2+ ions. In the same way as other negatively charged proteins, osteopontin, BSP, amelogenin and dentin matrix protein, our chimeric silk-BSP protein retained the ability to form supramolecular aggregates and in the presence of Ca2+ ions these aggregates generated networks which, as in the case of amelogenin64, co-existed with protein monomers and multimers. These structures were not observed in the presence of Mg2+ ion which suggests affinity of the BSP domain to Ca2+ over other divalent ions as Mg2+. The size of Ca2+ ion electron cloud may be the cause for this selectivity66.
Furthermore, in the case of the 6mer+BSP protein the network-forming behaviour could be potentiated due to the presence of the spider silk domain (6mer). AFM mechanical and structural studies with a recombinant dragline silk protein showed that this protein spontaneously forms long nanofibers with high intersegment flexibility. When subjected to a pulling force the force vs. piezo extension curves displayed a saw-tooth rupture pattern most probably due to the presence of sacrificial bonds9. Similar patterns were obtained with the capture silk fibers from Araneus, a orb-weaving spider, where a pulling force revealed rupture peaks due to the break of sacrificial bonds, that reform after relaxation of the fibers42. These rupture peaks are also characteristic of the composite materials and proteins mentioned above, placing silk fibers in the category of the self-healing biomaterials42. Although we did not observe the formation of nanofibers when the 6mer was dissolved in HEPES alone, the formation of supra-molecular complexes resembling fibers was observed when Ca was added to the HEPES solution. These results are in accordance with the outcomes of other studies where AFM67 and dynamic light scattering (DLS)68 were used to assess the behaviour of fibroin, from Bombyx mori, in the presence of Ca2+ ions. In these studies, silk fibroin molecules gave rise to intermolecular networks through the formation of ionic bonds between divalent ions, mainly Ca2+, and the anionic carboxylic groups (COO−) of fibroin amino acid groups67, 68.
CD spectra indicated that no conformational change was induced by the presence of Ca2+ ions, suggesting that the interaction between 6mer+BSP and 6mer and Ca is probably induced by electrostatic attractions rather than by a conformational change in the protein structure69. Moreover, there are some differences between the secondary conformations determined by ATR-FTIR and CD for 6mer+BSP and 6mer proteins. These differences are probably due to the different treatments to which samples were subjected before ATR-FTIR and CD analyses. The treatment with methanol removes water molecules from the 6mer+BSP and 6mer films inducing a rearrangement of the hydrogen bonding leading to an increase in the β-sheet content67. In the case of CD analysis 6mer+BSP and 6mer proteins were dissolved in a aqueous solution and water molecules disrupt inter- and intra-molecular hydrogen bonding allowing for protein molecules to move with greater freedom and thus forming structures more flexible than β-sheets34. Additionally, different studies show the importance of protein-solvent interactions in protein structure, indicating that protein conformation can change according to the solvent used70, 71. This is likely the case for the differences in the secondary conformations obtained with ATR-FTIR and CD analyses.
As mentioned previously and based on the results obtained by different authors, Ca2+ ions seems to be a crucial element for the maintenance of mechanical integrity of many biological systems. The development of new biocomposite materials for biomedical applications is a desired goal. The design of novel organic-inorganic hybrid biomaterials72, such as those described in the present work, may provide a new family of high performance structures for bone regeneration. The results discussed above re-enforce the potential of 6mer+BSP proteins in the development of these types of new hybrid biomaterials, where design principles can be employed in specialized designs for structural and functional outcomes.
5. Conclusions
The main goal of the present study was to assess the mechanical and structural characteristics of a new recombinant protein, 6mer+BSP, using AFM for imaging and force spectroscopy. In our previous work 11 this protein retained mineralization potential attributed to the BSP domain and sustained human mesenchymal stem cell proliferation and differentiation into the osteogenic lineage. However, if this protein is to be used for bone regeneration applications additional mechanical and structural studies were required. The force curves collected for the 6mer and 6mer+BSP films showed that the 6mer+BSP had a higher stiffness, likely due to the glutamic acid residues. Furthermore, the behaviour of the new recombinant protein in the presence of Ca, and as reported previously by others for osteopontin, amelogenin and dentin matrix protein, the present chimeric protein retained the ability to form supramolecular networks in the presence of Ca2+ ions through ionic cross-linking. This study shows the potential for new bioengineered polymers, such as 6mer+BSP, for the design of new nanocomposite systems. The presence of the silk domain in 6mer+BSP protein allows this biopolymer to be processed into different three-dimensional scaffolds. In addition, the BSP domain with its Ca affinity provides functions as an organic glue for use in new synthetic nanoscale composites, cross-linking organic and inorganic components, such as hydroxyapatite crystals, and increasing the stiffness and toughness of these systems by dissipating energy through the break of sacrificial bonds.
Acknowledgments
Sílvia Gomes thanks the Foundation for Science and Technology (FCT) for supporting her PhD grant, SFRH/BD/28603/2006. This work was carried out under the scope of the European NoE EXPERTISSUES (NMP3-CT-2004-500283), the Chimera project (PTDC/EBB-EBI/109093/2008) funded by the FCT agency, the NIH (P41 EB002520) Tissue Engineering Resource Center and the NIH (EB003210 and DE017207).
Contributor Information
Sílvia Gomes, Email: silvia.gomes@dep.uminho.pt.
Keiji Numata, Email: keiji.numata@riken.jp.
Isabel B. Leonor, Email: belinha@dep.uminho.pt.
João F. Mano, Email: jmano@dep.uminho.pt.
Rui L. Reis, Email: rgreis@dep.uminho.pt.
David L. Kaplan, Email: David.Kaplan@tufts.edu.
References
- 1.Scheibel T. Microb Cell Fact. 2004;3:14–24. doi: 10.1186/1475-2859-3-14. [DOI] [PMC free article] [PubMed] [Google Scholar]
- 2.Foo CWP, Bini E, Huang J, Lee SY, Kaplan DL. Appl Phys Mater Sci Process. 2006;82:193–203. [Google Scholar]
- 3.Hayashi CY, Shipley NH, Lewis RV. Int J Biol Macromol. 1999;24:271–275. doi: 10.1016/s0141-8130(98)00089-0. [DOI] [PubMed] [Google Scholar]
- 4.Beek JDv, Hess S, Vollrath F, Meier BH. Proc Natl Acad Sci USA. 2002;99:10266–10271. doi: 10.1073/pnas.152162299. [DOI] [PMC free article] [PubMed] [Google Scholar]
- 5.Altman GH, Diaz F, Jakuba C, Calabro T, Horan RL, Chen J, Lu H, Richmond J, Kaplan DL. Biomaterials. 2003;24:401–416. doi: 10.1016/s0142-9612(02)00353-8. [DOI] [PubMed] [Google Scholar]
- 6.Gosline J, Lillie M, Carrington E, Guerette P, Ortlepp C, Savage K. Philos Trans R Soc Lond B Biol Sci. 2002;357:121–132. doi: 10.1098/rstb.2001.1022. [DOI] [PMC free article] [PubMed] [Google Scholar]
- 7.Wall JC, Chatterji SK, Jeffery JW. Calcif Tissue Int. 1979;27:105–108. doi: 10.1007/BF02441170. [DOI] [PubMed] [Google Scholar]
- 8.Stark M, Grip S, Rising A, Hedhammar M, Engström W, Hjälm G, Johansson J. Biomacromolecules. 2007;8:1695–1701. doi: 10.1021/bm070049y. [DOI] [PubMed] [Google Scholar]
- 9.Oroudjev E, Soares J, Arcidiacono S, Thompson JB, Fossey SA, Hansma HG. Proc Natl Acad Sci USA. 2002;99:6460–6465. doi: 10.1073/pnas.082526499. [DOI] [PMC free article] [PubMed] [Google Scholar]
- 10.Rabotyagova O, Cebe P, Kaplan DL. Biomacromolecules. 2009;10:229–236. doi: 10.1021/bm800930x. [DOI] [PubMed] [Google Scholar]
- 11.Gomes S, Leonor IB, Mano JF, Reis RL, Kaplan DL. Soft Matter. 2010 Submitted. [Google Scholar]
- 12.Baht GS, Hunter GK, Goldberg HA. Matrix Biology. 2008;27:600–608. doi: 10.1016/j.matbio.2008.06.004. [DOI] [PubMed] [Google Scholar]
- 13.Mizuno M, Imai T, Fujisawa R, Tani H, Kuboki Y. Calcif Tissue Int. 2000;66:388–396. doi: 10.1007/s002230010078. [DOI] [PubMed] [Google Scholar]
- 14.Valverde P, Zhang J, Fix A, Zhu J, Ma W, Tu Q, Chen1 J. J Bone Miner Res. 2008;23:1775–1778. doi: 10.1359/JBMR.080605. [DOI] [PMC free article] [PubMed] [Google Scholar]
- 15.Domke J, Radmacher M. Langmuir. 1998;14:3320–3325. [Google Scholar]
- 16.Schäfer A, Vehoff T, Glis3vi3 A, Salditt T. Eur Biophys J. 2008;37:197–204. doi: 10.1007/s00249-007-0216-5. [DOI] [PubMed] [Google Scholar]
- 17.Ganss B, Kim RH, Sodek J. Crit Rev Oral Biol Med. 1999;10:79–98. doi: 10.1177/10454411990100010401. [DOI] [PubMed] [Google Scholar]
- 18.Goldberg H, Warner K, Li M, Hunter G. Connect Tissue Res. 2001;42:25–37. doi: 10.3109/03008200109014246. [DOI] [PubMed] [Google Scholar]
- 19.Fantner GE, Adams J, Turner P, Thurner PJ, Fisher LW, Hansma PK. Nano Lett. 2007;7:2491–2498. doi: 10.1021/nl0712769. [DOI] [PubMed] [Google Scholar]
- 20.He G, Dahl T, Veis A, George A. Connect Tissue Res. 2003;44:240–245. [PubMed] [Google Scholar]
- 21.Kowalewski T, Holtzman DM. Proc Natl Acad Sci USA. 1999;96:3688–3693. doi: 10.1073/pnas.96.7.3688. [DOI] [PMC free article] [PubMed] [Google Scholar]
- 22.Cacciafesta P, Hallam KR, Watkinson AC, Allen GC, Miles MJ, Jandt KD. Surf Sci. 2001;491:405–420. [Google Scholar]
- 23.Gadelmawla ES, Koura MM, Maksoud TMA, Elewa IM, Soliman HH. J Mater Process Technol. 2002;123:133–145. [Google Scholar]
- 24.Johnson KL. Contact mechanics. Cambridge University Press; Cambridge: 1994. [Google Scholar]
- 25.Sneddon IN. Int J Eng Sci. 1965;3:47–57. [Google Scholar]
- 26.Schäfer A, Vehoff T, Glišovi3 A, Salditt T. European Biophysics Journal. 2008;37:197–204. doi: 10.1007/s00249-007-0216-5. [DOI] [PubMed] [Google Scholar]
- 27.Radmacher M, Fritz M, Kacher CM, Cleveland JP, Hansma PK. Biophys J. 1996;70:556–567. doi: 10.1016/S0006-3495(96)79602-9. [DOI] [PMC free article] [PubMed] [Google Scholar]
- 28.Wagh AA, Roan E, Chapman KE, Desai LP, Rendon DA, Eckstein EC, Waters CM. Am J Physiol Lung Cell Mol Physiol. 2008;295:L54–L60. doi: 10.1152/ajplung.00475.2007. [DOI] [PMC free article] [PubMed] [Google Scholar]
- 29.Hu X, Kaplan D, Cebe P. Macromolecules. 2006;39:6161–6170. [Google Scholar]
- 30.Arrondo J, Goñi F. Prog Biophys Mol Biol. 1999;72:367–405. doi: 10.1016/s0079-6107(99)00007-3. [DOI] [PubMed] [Google Scholar]
- 31.Rabotyagova OS, Cebe P, Kaplan DL. Macromol Biosci. 2010;10:49–59. doi: 10.1002/mabi.200900203. [DOI] [PubMed] [Google Scholar]
- 32.Cerpa R, Cohen FE, Kuntz ID. Fold Des. 1996;1:91–101. doi: 10.1016/S1359-0278(96)00018-1. [DOI] [PubMed] [Google Scholar]
- 33.Kelly SM, Jess TJ, Price NC. Biochim Biophys Acta. 2005;1751:119–139. doi: 10.1016/j.bbapap.2005.06.005. [DOI] [PubMed] [Google Scholar]
- 34.Pérez-Rigueiroa J, Viney C, Llorca J, Elices M. Polymer. 2000;41:8433–8439. [Google Scholar]
- 35.Mano JF. Macromol Biosci. 2008;8:69–76. doi: 10.1002/mabi.200700139. [DOI] [PubMed] [Google Scholar]
- 36.Marsha RE, Coreya RB, Pauling L. Biochim Biophys Acta. 1955;16:1–34. doi: 10.1016/0006-3002(55)90178-5. [DOI] [PubMed] [Google Scholar]
- 37.Fulara A, Dzwolak W. J Phys Chem B. 2010;114:8278–8283. doi: 10.1021/jp102440n. [DOI] [PubMed] [Google Scholar]
- 38.Zanuy D, Alemán C, Muñoz-Guerra S. Int J Biol Macromol. 1998;23:175–184. doi: 10.1016/s0141-8130(98)00047-6. [DOI] [PubMed] [Google Scholar]
- 39.Pérez-Rigueiro J, Viney C, Llorca J, Elices M. Polymer. 2000;41:8433–8439. [Google Scholar]
- 40.Yin J, Chen E, Porter D, Shao Z. Biomacromolecules. 2010 doi: 10.1021/bm100643q. [DOI] [PubMed] [Google Scholar]
- 41.Gosline JM, Guerette PA, Ortleepp CS, Savage KN. J Exp Biol. 1999;202:3295–3303. doi: 10.1242/jeb.202.23.3295. [DOI] [PubMed] [Google Scholar]
- 42.Becker N, Oroudjev E, Mutz S, Cleveland JP, Hansma PK, Hayashi CY, Makarov DE, Hansma HG. Nat Mater. 2003;2:278–283. doi: 10.1038/nmat858. [DOI] [PubMed] [Google Scholar]
- 43.Smith BL, Schäffer TE, Viani M, Thompson JB, Frederick NA, Kindt J, Belcher A, Stucky GD, Morse DE, Hansma PK. Nature. 1999;399:761–763. [Google Scholar]
- 44.Boussu K, Bruggen Vd, Volodin A, Snauwaert J, Haesendonck CV, Vandecasteele C. J Colloid Interface Sci. 2005;286:632–638. doi: 10.1016/j.jcis.2005.01.095. [DOI] [PubMed] [Google Scholar]
- 45.Koinkar VN, Bhushan B. J Appl Phys. 1997;81:2472–2479. [Google Scholar]
- 46.Poon CY, Bhushan B. Wear. 1995;190:76–88. [Google Scholar]
- 47.Poon CY, Bhushan B. Wear. 1995;190:89–109. [Google Scholar]
- 48.Sedin DL, Rowlen KL. Appl Surf Sci. 2001;182:40–48. [Google Scholar]
- 49.Huang HH, Ho CT, Lee TH, Leec TL, Liao KK, Chen FL. Biomol Eng. 2004;21:93–97. doi: 10.1016/j.bioeng.2004.05.001. [DOI] [PubMed] [Google Scholar]
- 50.Lincks J, Boyan BD, Blanchard R, Lohmann CH, Liu Y, Cochran DL, Dean DD, Schwartz Z. Biomaterials. 1998;19:2219–2232. doi: 10.1016/s0142-9612(98)00144-6. [DOI] [PubMed] [Google Scholar]
- 51.Zinger O, Anselme K, Denzer A, Habersetzer P, Wieland M, Jeanfils J, Hardouin P, Landolta D. Biomaterials. 2004;25:2695–2711. doi: 10.1016/j.biomaterials.2003.09.111. [DOI] [PubMed] [Google Scholar]
- 52.Wu Y, Zitelli JP, TenHuisen KS, Yu X, Libera MR. Biomaterials. 2011;32:951–960. doi: 10.1016/j.biomaterials.2010.10.001. [DOI] [PubMed] [Google Scholar]
- 53.Chauvy PF, Madore C, Landolt D. Surf Coat Technol. 1998;110:48–56. [Google Scholar]
- 54.Jackson AP, Vincenta JFV, Turner RM. Compos Sci Technol. 1989;36:255–266. [Google Scholar]
- 55.Weiner S. Crit Rev Biochem Mol Biol. 1986;20:365–408. doi: 10.3109/10409238609081998. [DOI] [PubMed] [Google Scholar]
- 56.Thompson JB, Kindt JH, Drake B, Hansma HG, Morse DE, Hansma1 PK. Nature. 2001:414. doi: 10.1038/414773a. [DOI] [PubMed] [Google Scholar]
- 57.Sun C, Fantner GE, Adams J, Hansma PK, Waite JH. J Exp Biol. 2007;210:1481–1488. doi: 10.1242/jeb.02759. [DOI] [PubMed] [Google Scholar]
- 58.Kroger N, Bergsdorf C, Sumper M. EMBO. 1994;13:4676–4683. doi: 10.1002/j.1460-2075.1994.tb06791.x. [DOI] [PMC free article] [PubMed] [Google Scholar]
- 59.Currey J. Nature. 2001;414:699. doi: 10.1038/414699a. [DOI] [PubMed] [Google Scholar]
- 60.Fantner GE, Hassenkam T, Kindt JH, Weaver JC, Birkedal H, Pechenik L, Cutroni JA, Cidade GAG, Stucky GD, Morse DE, Hansma PK. Nat Mater. 2005;4:612–616. doi: 10.1038/nmat1428. [DOI] [PubMed] [Google Scholar]
- 61.Gupta HS, Fratzl P, Kerschnitzki M, Benecke G, Wagermaier W, Kirchner HOK. J R Soc Interface. 2007;4:277–282. doi: 10.1098/rsif.2006.0172. [DOI] [PMC free article] [PubMed] [Google Scholar]
- 62.Gupta HS, Wagermaier W, Zickler GA, Aroush DR-B, Funari SS, Roschger P, Wagner HD, Fratzl P. Nano Lett. 2005;5:2108–2111. doi: 10.1021/nl051584b. [DOI] [PubMed] [Google Scholar]
- 63.Hansma PK, Fantner GE, Kindt JH, Thurner PJ, Schitter G, Turner PJ, Udwin SF, Finch MM. J Musculoskelet Neuronal Interact. 2005;5:313–315. [PubMed] [Google Scholar]
- 64.Fincham AG, Moradian-Oldak J, Simmer JP, Sarte P, Lau EC, Diekwisch T, Slavkin HC. J Struct Biol. 1994;112:103–109. doi: 10.1006/jsbi.1994.1011. [DOI] [PubMed] [Google Scholar]
- 65.Adams J, Fantner GE, Fisher LW, Hansma PK. Nanotechnology. 2008;19:384008–384015. doi: 10.1088/0957-4484/19/38/384008. [DOI] [PMC free article] [PubMed] [Google Scholar]
- 66.Williams RJP. A general introduction to the special properties of the calcium ion and their deployment in biology. In: Siegel FL, Carafoli E, Kretsinger RH, MacLennan DH, Wasserman R, editors. Calcium Binding Proteins: Structure and Function. Elsevier Noth Holland Inc; NY: 1980. [Google Scholar]
- 67.Yamada K, Tsuboi Y, Itaya A. Thin Solid Films. 2003;440:208–216. [Google Scholar]
- 68.Hossain KS, Nemoto N. Langmuir. 1999;15:4114–4119. [Google Scholar]
- 69.Yang Y, Cui Q, Sahai N. Langmuir. 2010;26:9848–9859. doi: 10.1021/la100192z. [DOI] [PubMed] [Google Scholar]
- 70.Alonso DOV, Daggett V. J Mol Biol. 1995;247:501–520. doi: 10.1006/jmbi.1994.0156. [DOI] [PubMed] [Google Scholar]
- 71.Schiffer CA, Dötsch V. Curr Opin Biotechnol. 1996;7:428–432. doi: 10.1016/s0958-1669(96)80119-4. [DOI] [PubMed] [Google Scholar]
- 72.Tang Z, Kotov NA, Magonov S, Ozturk B. Nat Mater. 2003;2:413–418. doi: 10.1038/nmat906. [DOI] [PubMed] [Google Scholar]


