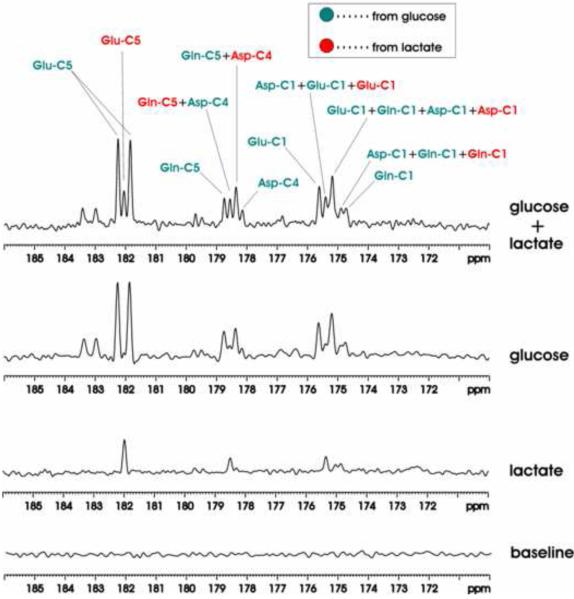
Figure 3.
Summed in vivo 13C MRS spectra. Baseline: no significant interfering signals were detected in the spectral region of interest. Lactate: only singlets of glutamate, glutamine and aspartate were detected during intravenous infusion of [2-13C]lactate. Glucose: only doublets were detected for glutamate C5, glutamine C5 and aspartate C4 during intravenous infusion of [13C6]-D-glucose. Glucose+lactate: both doublets and singlets were detected for glutamate C5, glutamine C5 and aspartate C4 during intravenous co-infusion of [13C6]-D-glucose and [2-13C]lactate. Each spectrum was averaged over the 0~180 minutes infusion period. Lactate: [2-13C] lactate, glucose: [13C6]-D-glucose. Parameters for data processing: lb = −15, gb = 0.12. Glu-C5: glutamate C5, Gln-C5: glutamine C5, Asp-C4: aspartate C4, Glu-C1: glutamate C1, Asp-C1: aspartate C1, Gln-C1: glutamine C1. Green: resonance lines originated from [13C6]-D-glucose; Red: resonance lines originated from [2-13C] lactate.

