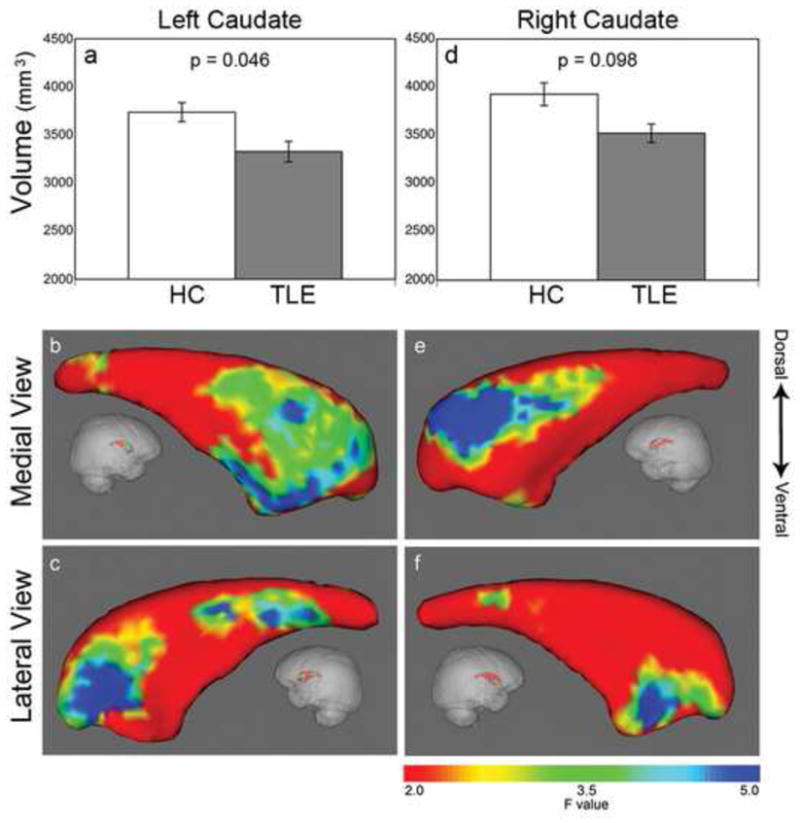
Figure 2.

Reduced caudate volumes and regional caudate atrophy profiles. Left caudate volume is significantly reduced in TLE (gray bar) while right caudate showed a trend level reduction, when compared to health controls (white bar) (a, d). Shape analysis showed atrophy is selective mainly for the caudate head. On the left side, the shrinkage is located in the anterodorsal and anteroventral caudate head as well as a smaller region in the tail (b, c). Similarly, on the right side, the atrophy is located in the anterodorsal and anteroventral caudate head (e, f). Color bar on the right indicates F-statistics for the shape analysis, with degrees of freedom of 3, 22, giving corresponding F=2 (red area), p=0.14; F=3.5 (green), p=0.03; F=5 (blue), p=0.009.
