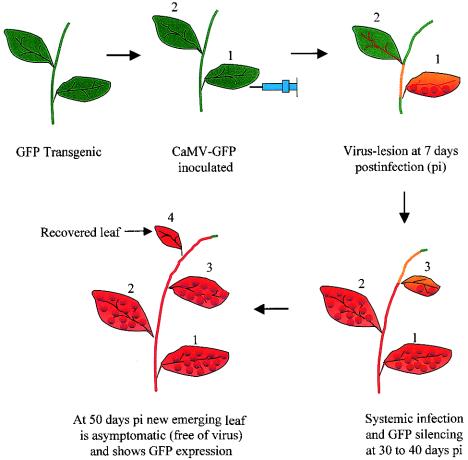
FIG. 1.
Schematic illustration of systemic viral spread as well as RNAi and subsequent viral recovery in plants. Green and red indicate the presence and loss of GFP fluorescence, respectively, and orange denotes the presence of both colors. The red dots on leaves show viral lesions. The bold arrows indicate the stages of plant growth, and the leaves are numbered accordingly. An arrow with a thin line shows a newly emerged leaf recovered from viral attack.

