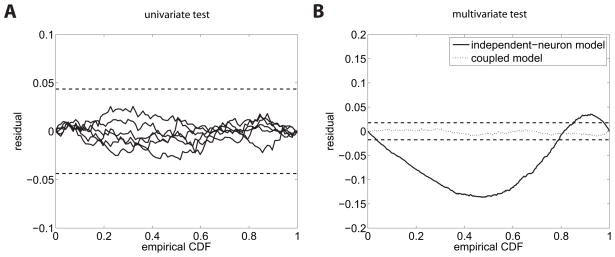
Figure 10.
Neurons with common input. (A) Residual KS plots for the univariate test. All lines lie within their 95% confidence bounds. (B) Residual KS plots for the superposed process of the multivariate test according to the independent-neuron assumption (solid line) and the coupled, correct model (dashed line).

