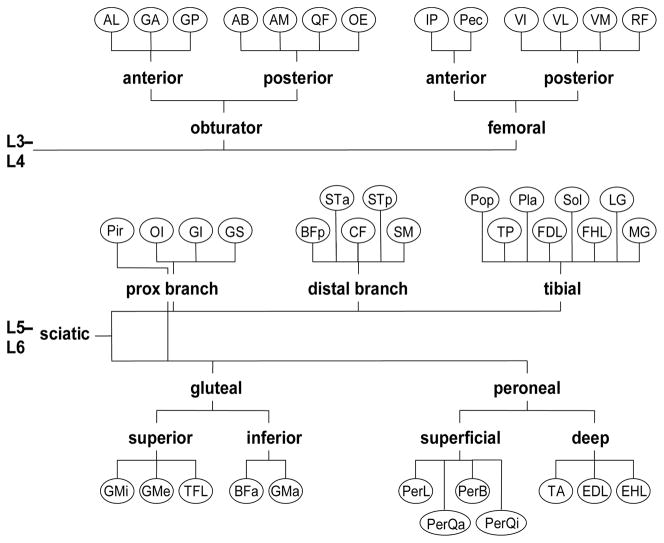
Figure 1.
A map of the innervation pattern of the rat hindlimb muscles. Muscles are depicted as nodes (abbreviations found in Table 2). Nerves and nerve fascicles are depicted as branches. Labels of the branches correspond to the muscle groups used in constructing feasible force envelopes in Table and 1. Grouping are derived from Greene [25] and direct observations during dissection of the limbs.

