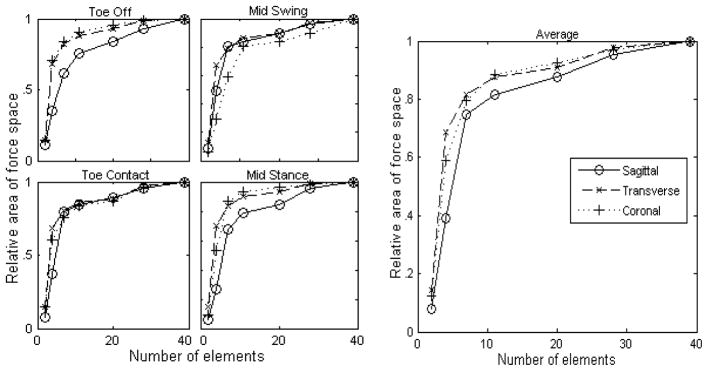
Figure 5.
Projected area of the force space producible as a function of the number of individually excitable elements. Projections into the sagittal (solid), transverse (dashed), and coronal planes (dotted) are shown. Area shown is relative to the area producible with individual muscle excitation. The four plots on the left show the areas at four stages of gait while the plot on the right shows the average across the four postures.

