
Figure 2.
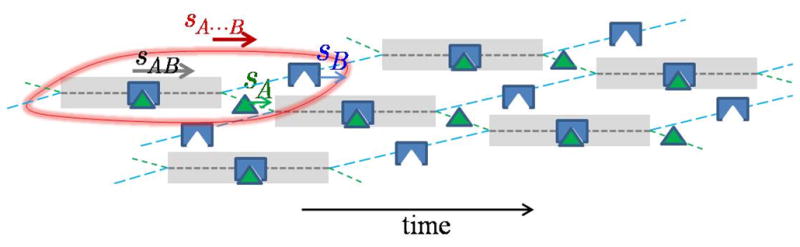
Cartoon of the effective particle A···B (encircled in red). Indicated is the fractional time that A (green) and B (blue) spend free or in complex (greyed time intervals). The representation is faithful with regard to relative concentrations, velocities, and species lifetimes. Component A spends a smaller fraction of time free than B, resulting in a match of their time-average velocities. An animation can be found at [50].