
Figure 8.
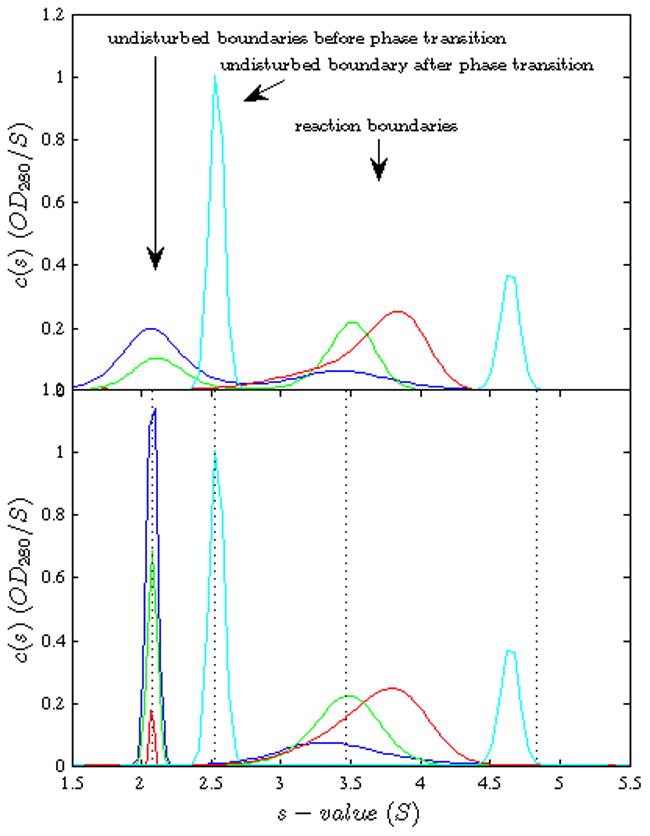
Experimental sedimentation coefficient distributions from a titration series of SBTI (~2.1 S) with increasing CT (~2.5 S). SBTI and CT were purchased from Worthington Biochemical (Lakewood, NJ), chromatographically purified and diluted into 50 mM Na/K phosphate, 150 mM NaCl, pH 7.4 buffer. Sedimentation experiments were carried out in a ProteomeLab XL-I analytical ultracentrifuge (Beckman Coulter Inc, Brea, CA) according to standard methods [58, 59] at 20°C and 59,000 rpm, recorded with absorbance optical system at 280 nm. Concentrations were constant 2.0 μM SBTI and 0.2 μM (blue), 0.6 μM (green), 2.0 μM (red), and 12.0 μM (cyan) of CT. Top Panel: First the standard c(s) analysis, with maximum entropy regularization at a confidence level of P = 0.68, was performed as described in [58]. Bottom Panel: In order to improve the separation of the peaks for precise integration, c(s) was recalculated with maximum entropy regularization enhanced with Bayesian prior knowledge of the s-values of the undisturbed boundary, also at a confidence level of P = 0.68. The vertical dotted lines indicate the s-values of both components (separately measured) and the best-fit s-values of the 1:1 and 2:1 complexes.