
Figure 3. MRI of ADC and histological analysis of necrosis.
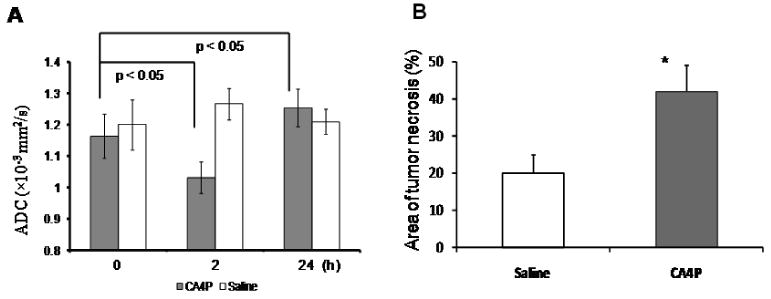
A) Mean ± se ADC for the group of tumors treated with CA4P (n = 6) or saline control (n = 3) was plotted. Significant decrease in ADC at 2 h and then increase at 24 h after CA4P was evident (p < 0.05; paired Student's t-test). B) Quantitation of tumor necrosis on H&E sections showed significantly higher fractions of necrosis in CA4P-treated tumors than saline controls (p < 0.05; unpaired Student's t-test).