
Figure 4. Pimonidazole staining of tumor hypoxia.
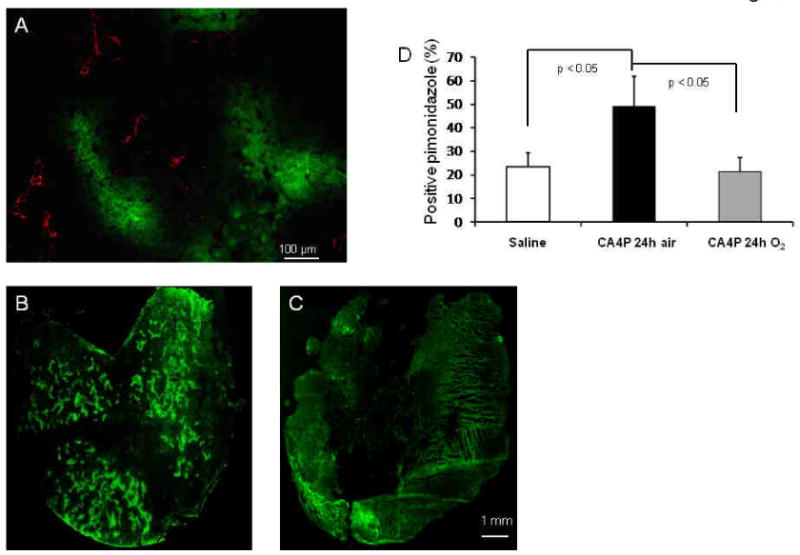
A) Pimonidazole staining of a saline control tumor revealed hypoxic regions (green) are typically located distant from blood vessels (CD31, red). B) CA4P induced extensive tumor hypoxia 24 h later, as shown in a central tumor section. C) Much less tumor hypoxia was detected in an animal, which breathed oxygen 24 h after CA4P. D) Quantitation of pimonidazole staining indicated significantly increased hypoxia in CA4P-treat tumors (mean = 49 ± 13 (sd)% vs. 23 ± 6% (saline); p < 0.05; unpired Student's t-test), while markedly reduced hypoxia was observed in oxygen-treated tumors (22 ± 6 (sd)%; * p < 0.05).