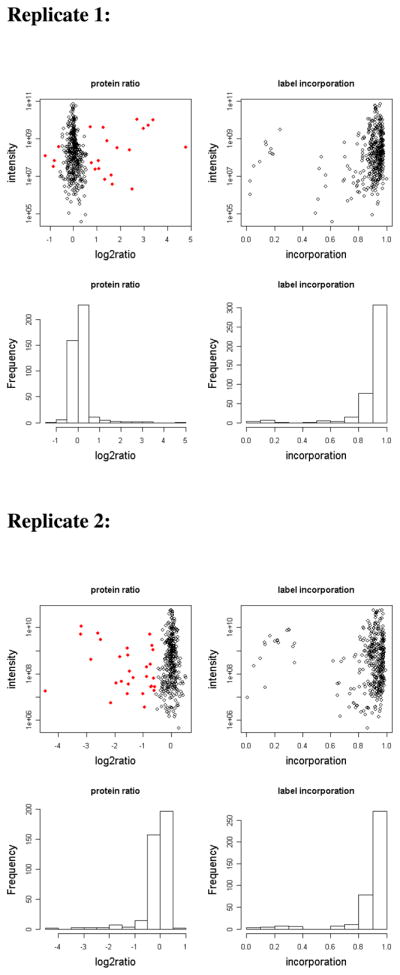
Figure 6. SILAC ratios and label incorporation of proteins identified from two replicates of the NT3 SILAC experiment.

Protein ratios were calculated as heavy/medium SILAC ratios. In replicate 1, the heavy labeled sample was stimulated and the medium labeled sample was used as a control. The labeling of the stimulated and control cells was reversed in the second replicate. Red dots represent proteins with SILAC ratios showing greater than 1.5-fold change in abundance in the pY IP after stimulation.
