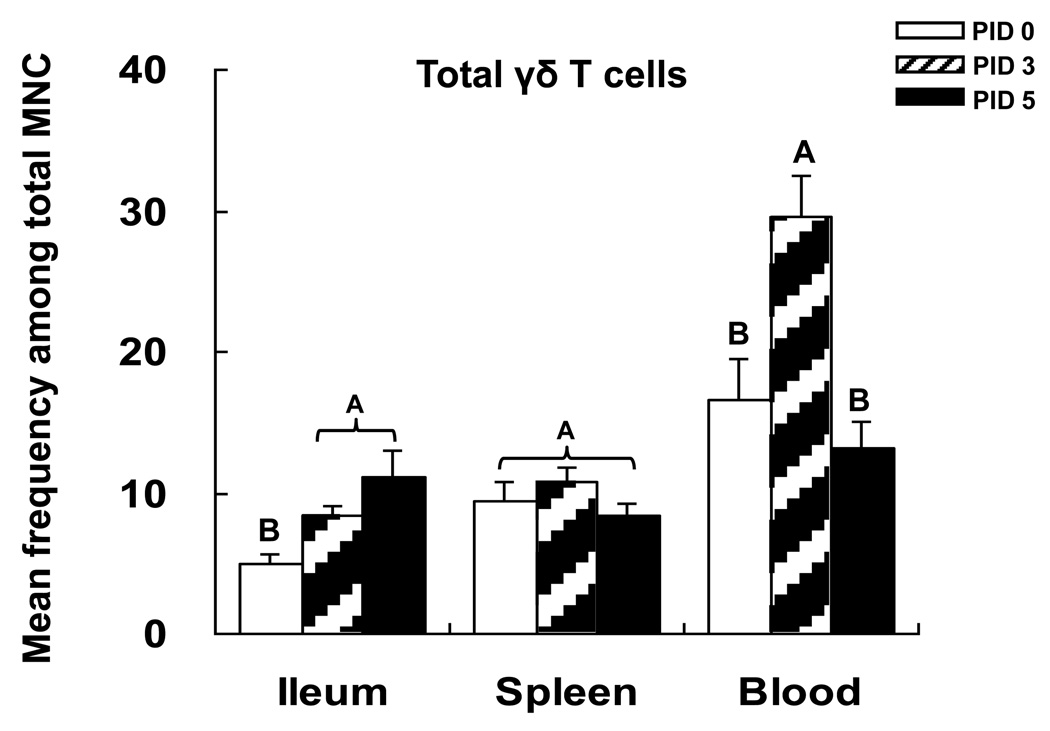
Fig. 2. Frequencies of total γδ T cells in VirHRV-infected Gn pigs.
Gn pigs were inoculated with virulent Wa HRV or mock inoculated and euthanized on PID 0, 3 and 5, respectively. The total γδ T cells were detected as shown in Fig. 1. The y-axis is the mean frequencies (%) of total γδ T cells among MNCs. The error bars represent standard error of the mean. The capital letters A, B, and C indicate the results of significance testing for differences among PID 0, 3 and 5. Unshared letters indicate significant difference among PID 0, 3 and 5 on frequencies of the total γδ T cells (Kruskal–Wallis rank sum test, p < 0.05, n=7–8), while shared letters indicate no significant difference.

