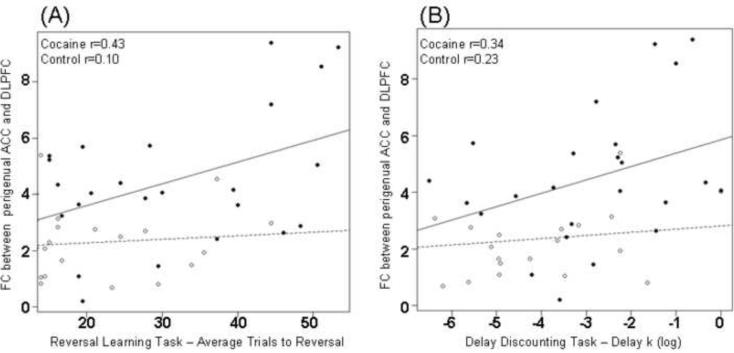
Figure 3.
Scatter plots showing correlations between resting functional connectivity strength (z-scores) perigenual ACC and DLPFC] and (A) reversal learning task and (B) delayed discounting task. Individual CD participants are represented by solid circles and normal participants by clear circles. ACC: Anterior cingulate cortex, DLPFC: dorsolateral prefrontal cortex, CD: cocaine dependent.

