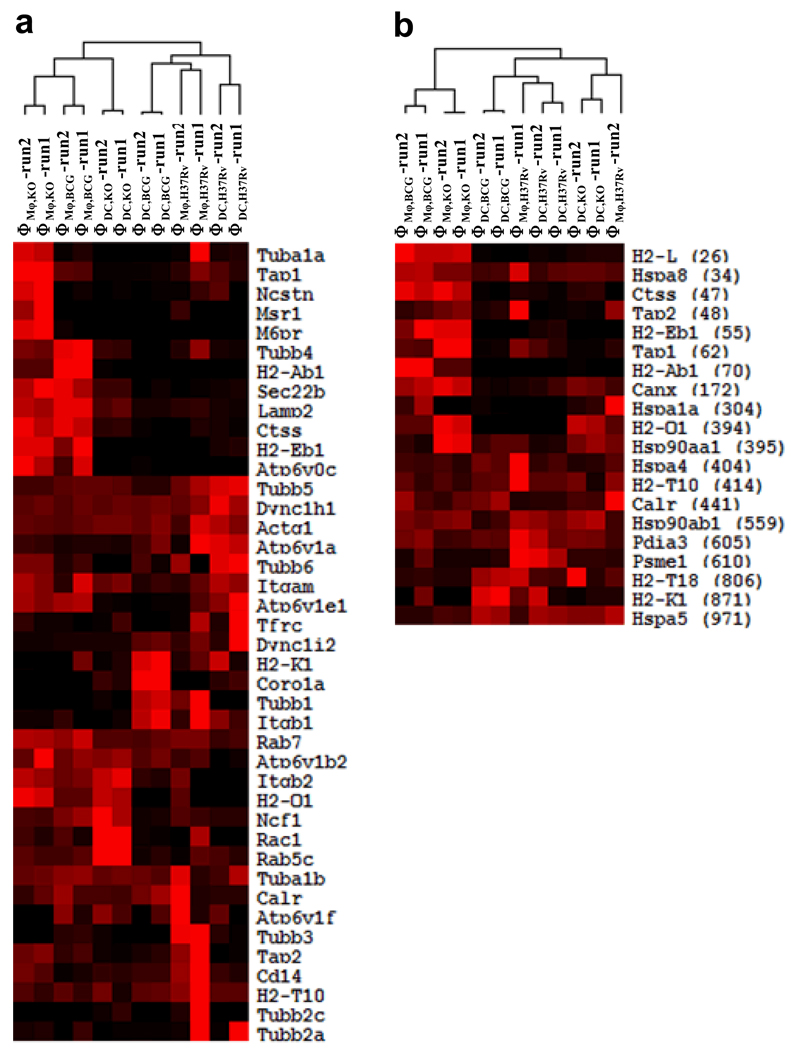
Figure 3. Clustering of the six phagosome samples based on the phagosome and antigen presentation pathway (panel a) or the antigen processing and presentation pathway (panel b).
The numbers in parenthesis in panel b indicate the rankings of the proteins in a GSEA leading edge analysis. In panel a, both the samples and proteins were clustered. In panel b, the samples were clustered while the proteins were ordered by their rankings in the GSEA analysis. The duplicate runs for each sample are shown.

