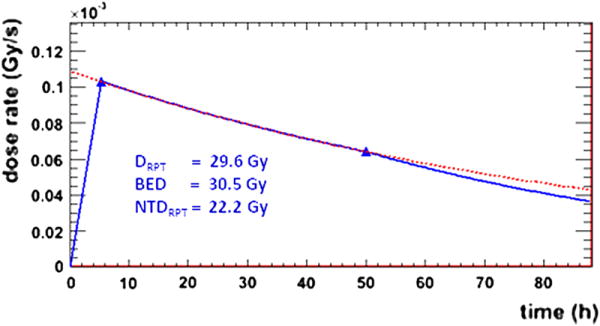
Figure 1.

dose rate plots for the tumor VOI. The blue triangles show the calculated dose rates and the blue lines represent the fit used to calculate the DRPT. The red dotted line shows the monoexponential fit. The resulting DRPT, BED, and NTDRPT values are also shown.
