
Figure 7. Coherence analysis reveals a reduction glomerulus-specific synchrony of mitral cells in OCAM knockouts.
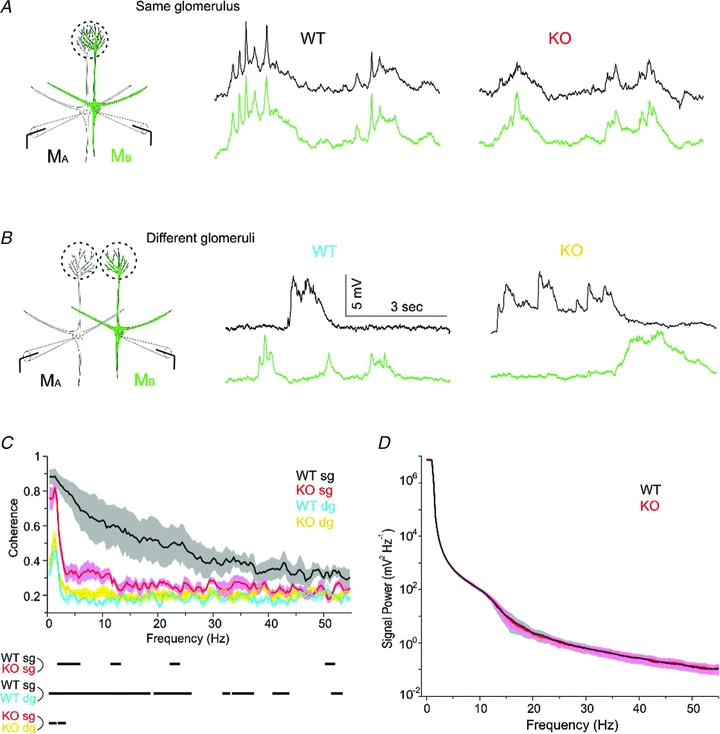
We recording spontaneous activity in current clamp recording from pairs of mitral cells A. In cells projecting to the same glomerulus, spontaneous activity in the two cells appeared nearly identical in the wild-type. B, for mitral cells that projected to different glomeruli, there was little overlap in spontaneous activity, indicating that correlated activity originated within the glomerulus. C, to assess the spectral content of the activity, we calculated the coherence in several conditions. The plot shows the coherence (±1 SEM, shaded area) for 4 wild-type pairs projecting to the same glomerulus (WT sg, black), 5 OCAM knockout pairs projecting to the same glomerulus (KO sg, red), 4 wild-type pairs projecting to different glomeruli (WT dg, purple), and 8 knockout pairs projecting to different glomeruli (KO dg, yellow). The dashes below the X-axis indicate frequencies at which the coherence was significantly different across conditions (P < 0.05). D, power spectra were computed for spontaneous activity of mitral cells used in the coherence analysis. There was no different in the spectral content between wild-type (n = 12) and OCAM knockout cells (n = 14). The plot shows the power spectrum ± 1 SEM.