
Figure 2. Reduced thermogenesis and heart rate (HR) in Pet-1−/− (KO) neonates during ambient cooling.
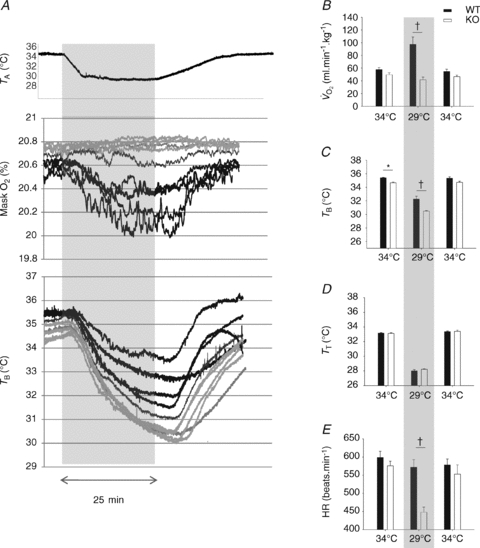
A, raw traces showing the changes in the fractional concentration of O2 leaving the mask (mask O2) and body temperature (TB) in Pet-1−/− animals (n = 5, grey lines) and littermates (WT) (n = 5, black lines) as ambient temperature (TA) is cooled from 34°C to 29°C over 25 min (shaded region). B, at 34°C, metabolic rate  is not significantly different in Pet-1−/− animals compared to WT. The disparity between genotypes becomes apparent as TA is reduced to 29°C (shaded region). C, at 34°C, TB is slightly but significantly lower in Pet-1−/− animals compared to WT. As is the case with
  , the disparity becomes greater with cooling to 29°C. D, there were no differences in tail temperature (TT) between Pet-1−/− and WT animals at either TA. Note: TT is less than 29°C because of a TA gradient within the chamber (TA was 1.5°C lower at the tail end compared to the middle). E, there is a significantly greater reduction in HR with cooling in Pet-1−/− animals compared to WT. All data in B–E are means ± SE. *Significant genotype effect, P < 0.05; †genotype ×TA interaction, P < 0.05.