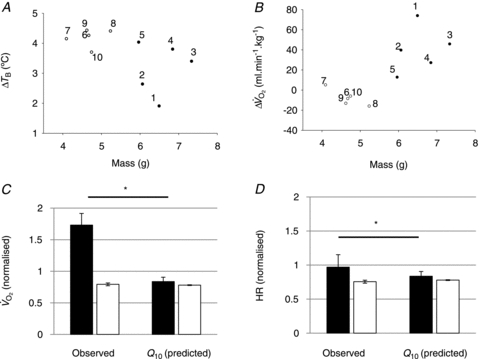
Figure 3. Effects of body size and Q10 on thermogenesis and HR during ambient cooling.

A and B, WT animals (filled circles, nos. 1–5) weigh more than Pet-1−/− animals (open circles, nos. 6–10), and mass has a significant relationship with TB and  (2-factor repeated-measures ANOVA: P < 0.05 for each). C and D,
  and HR after cooling (normalised to baseline values) for WT (filled bars), and Pet-1−/− (open bars). Shown are observed values and values predicted from the Q10 effect alone (assuming Q10 co-efficient of 2 and with a drop in TB of 4.2°C in Pet-1−/− and 3.1°C in WT). Data in C and D are means ± SE. *Significant difference exists between observed WT values for
  and HR and the values predicted from the Q10 effect alone. No such difference exists between the observed and predicted values for Pet-1−/− animals.
