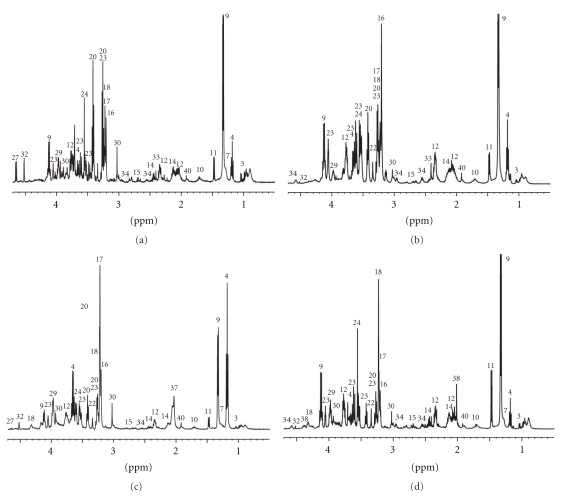
Figure 1.
Representative 1D 1H CPMG HRMAS spectra of healthy ovarian tissues (a) and endometrial (b), mucinous (c) and serous (d) carcinomas. Partial metabolite assignment in the 4.7–0.5 ppm region is indicated. The numbers refer to the metabolites listed in Table 1. The metabolic content of healthy and cancerous biopsies can be directly compared, since the intensity of each spectrum was normalized with respect to the amplitude of the digital Eretic signal and the weight of biopsy present in each sample.

