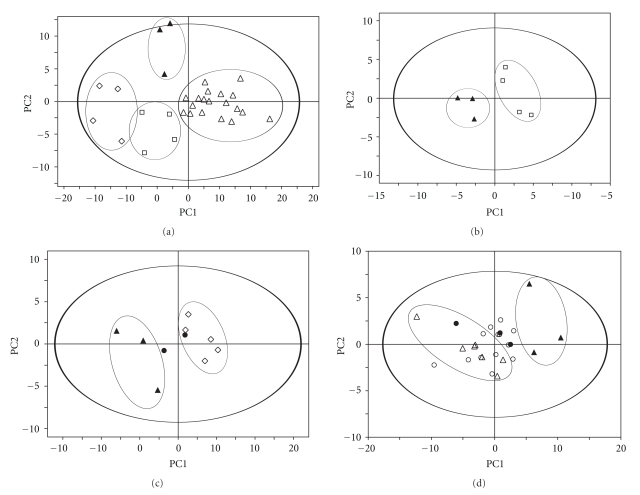
Figure 2.
Score plot of the first two principal components (PC1, PC2) from PLS-DA model obtained when comparing: (a) Healthy ovarian tissues (filled triangle) versus the 3 epithelial carcinomas: mucinous (open diamond), endometrioid (open square) and serous (open triangle). Model parameters: R 2 Y = 0.75, Q 2 = 0.50. (b) Healthy ovarian tissues (full triangle) versus endometrioid carcinomas (open square). Model parameters: R 2 Y = 0.96, Q 2 = 0.45. (c) Healthy ovarian tissues (full triangle) versus mucinous carcinomas (open diamond). Model parameters: R 2 Y = 0.94, Q 2 = 0.69. (d) Healthy ovarian tissues (full triangle) versus high Silverberg score (grade III) of serous carcinomas (open triangle). Model parameters: R 2 Y = 0.91, Q 2 = 0.68. In these models, the predicted borderline cases are represented by filled circles (c, d) and the predicted low Silverberg score (grade I-II) serous carcinomas by open circles (d).

