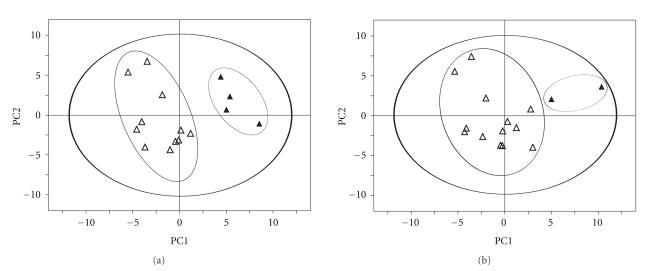
Figure 3.
Score plot of the first two principal components (PC1 and PC2) from PLS-DA models obtained when correlating the metabolic data with: (a) Patient 24 months survival rate (superior to 24 months as open triangle inferior to 24 months as full triangle). Model parameters: R 2 Y = 0.85, Q 2 = 0.51. (b) Response to chemotherapy (positive response as open triangle negative response as full triangle). Model parameters: R 2 Y = 0.85, Q 2 = 0.42.

