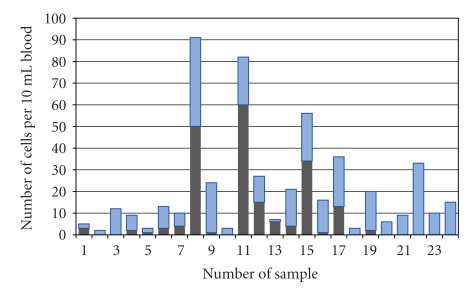
Figure 7.
Clinical breast cancer samples sequentially stained with anti-CK and with CEE-Enhanced. The antibody mixture was used to capture CTCs. The dark bars on the bottom represent the number of CK positive cells detected in a sequential series of stage IV breast cancer samples. The location of these cells was recorded and then the channel was restained with CE. The light bars on top represent the newly detected CTCs after CE stain. All cells designated as positive were CD45 negative and DAPI positive.

