
Figure 12.
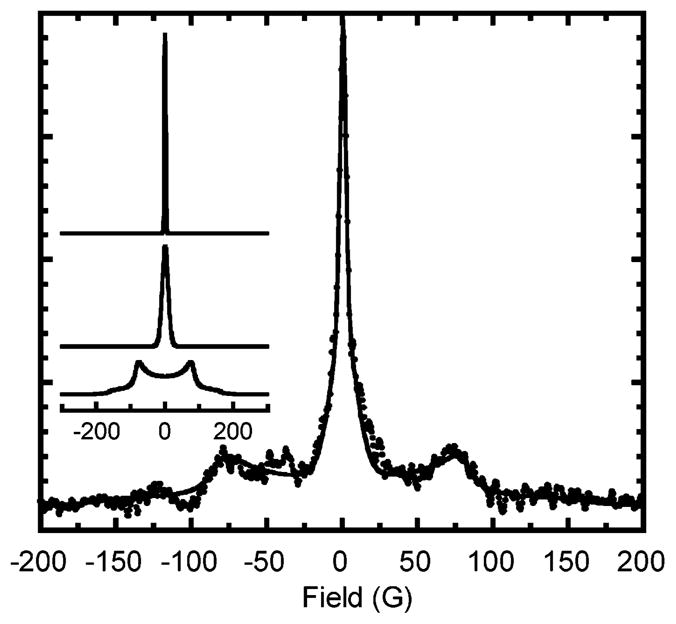
Dipolar broadening function. The dipolar broadening function (dots) was determined by Fourier transform deconvolution of the bisnitroxide EPR spectrum with the mononitroxide TIPNO spectrum. The simulated broadening function (solid line) is the sum of the three functions shown in the inset. They are, from the top, a narrow Gaussian (2.25 G fwhm and 9% of total area), a broader Gaussian (20 G fwhm and 30% of total area), and a “Pake” function (150 G wide and 61% of total area).