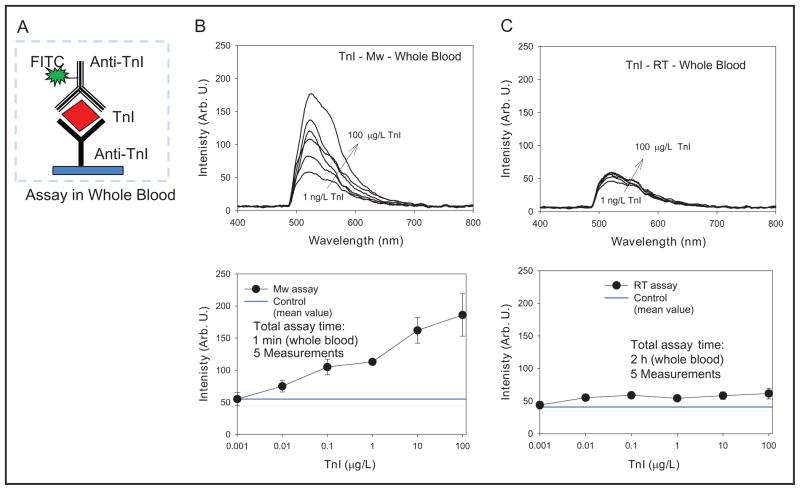
Fig. 6.
(A), Schematic depiction of the TnI immunoassay run on SNFs in whole blood.
(B and C, top), TnI-concentration– dependent fluorescence emission spectra. (B and C, bottom), TnI-concentration– dependent fluorescence emission intensity at 520 nm from the TnI immunoassays run in buffer at room temperature (RT) and using microwave (Mw) heating. Arb. U., arbitrary units.

