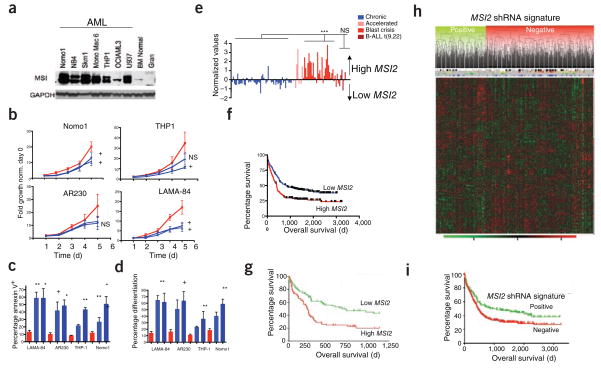
Figure 4.
Increased MSI2 expression in human myeloid leukemias is associated with aggressive disease and immature phenotype. (a) Immunoblot analysis in human AML cell lines, normal human bone marrow cell and granulocytes. The MSI2 doublet indicates two alternative isoforms from the MSI2 gene. (b) Cell proliferation in the indicated cell lines after infection with lentivirus expressing control or MSI2-specific shRNAs. Error bars indicate s.e.m. from at least five independent experiments per cell line scramble control (red) and two different shRNAs (blue). (c,d) Apoptosis and differentiation based on annexin staining and CD16, CD11b staining. A representative flow cytometric plot is shown in Supplementary Figure 11d; error bars represent s.e.m. from at least three independent experiments. +P < 0.05, *P < 0.01, **P < 0.001. (e) Analysis of Oncomine gene expression data with increased MSI2 expression in myeloid blast crisis (n = 33) versus chronic phase (n = 57, P < 0.001)24,30, accelerated phase (n = 9) and lymphoid leukemia (B-ALL; n = 6). (f) Survival analysis in human subjects (n = 436) of the Bullinger data set stratified by MSI2 expression. MSI2 high and low expression is detailed in the Supplementary Methods, (median survival, 693 d versus 238 d; P = 0.0004. (g) Survival analysis in human subjects (n = 163), in the Metzeler data set for the cohort of CN-AML divided by MSI2 expression27. (h) Unsupervised clustering of the MSI2 shRNA gene signature in the human subjects from the Bullinger data set in f. Gene expression patterns of the subjects with the positive cluster represents subjects that fit with the MSI2–knocked-down gene signature, whereas the negative cluster represents subjects that cluster into a separate group from the shRNA gene signature. Subjects with MSI2-high expression in red and MSI2-low expression in green are plotted above the clustering based on f. The FLT3 internal tandem mutation is indicated by blue lines, and NPM1 status is indicated with black lines. (i) Overall survival plot of positive correlation and negative correlation clusters from the MSI2 shRNA gene expression signature in h. P < 0.004.

