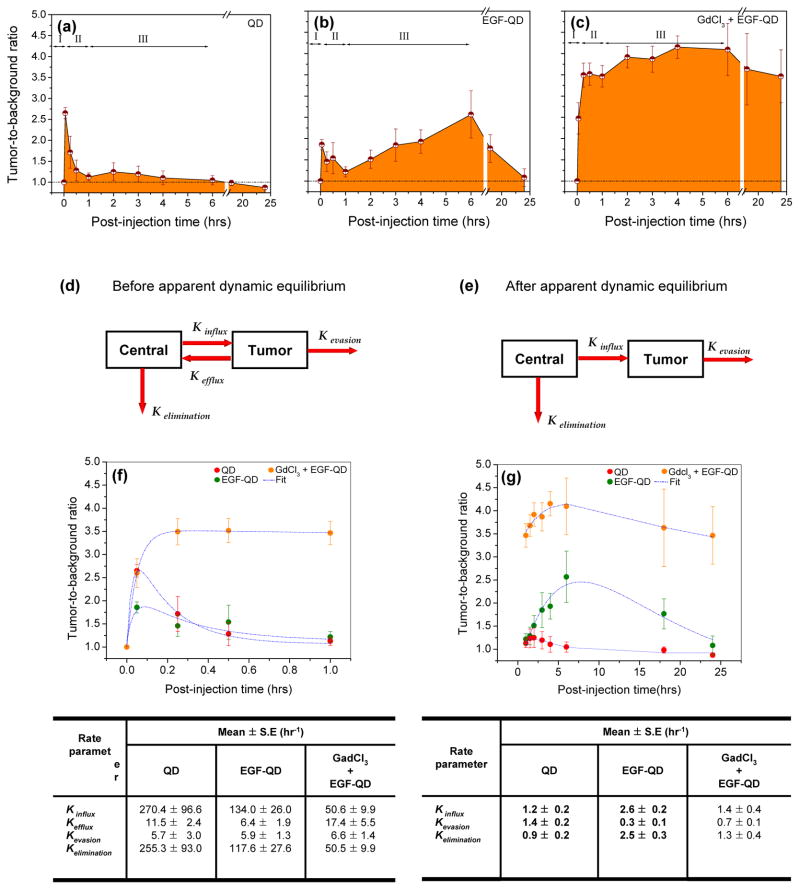
Figure 2.
Estimated mean tumor-to-background ratios (mean ± SE) from animals injected with (a) QD, (b) EGF-QD, or (c) GdCl3 followed by EGF-QD. The three phases of influx, efflux, and accumulation are represented as I, II, and III, respectively. Based on the observed kinetic pattern, a two-compartment model was proposed to estimate the kinetic rate parameters (d) before and (e) after apparent dynamic equilibrium. The two-compartment model fit (blue dotted lines) to the tumor-to-background ratios before and after dynamic equilibrium is illustrated in (f) and (g), respectively, with the corresponding rate parameters represented in tables below the figures.

