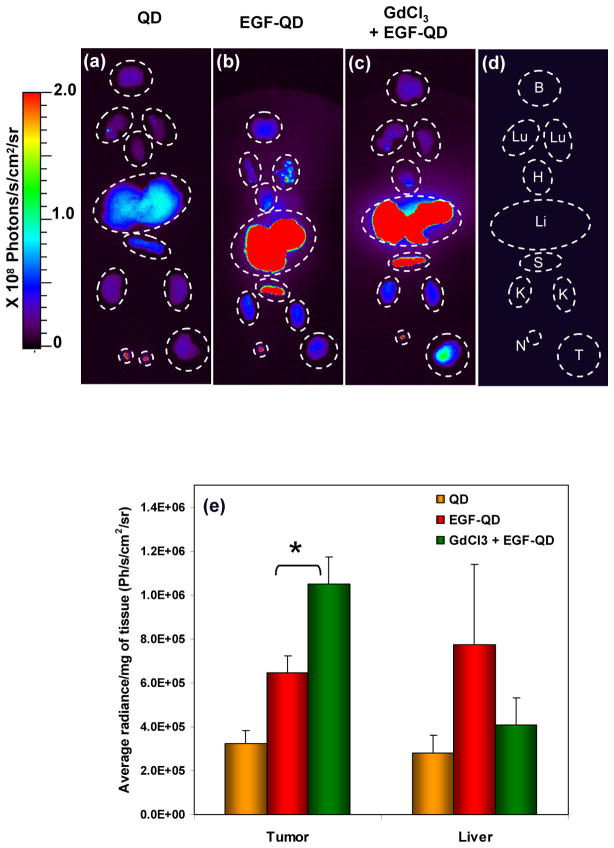
Figure 3.
Ex vivo fluorescence images of organs harvested 4 h after (a) QD injection, (b) EGF-QD injection, and (c) GdCl3 pretreatment followed by EGF-QD injection. (d) A cartoon representing the arrangement of organs where B, Lu, H, Li, S, K, N, and T represent the brain, lungs, heart, liver, spleen, kidney, lymph node, and tumor, respectively. The corresponding fluorescence levels (mean ± SE) from the extracts of tumor and liver tissues are represented in (e), where * represents the statistical significance (p < 0.001) based on an unpaired Student’s t test.

