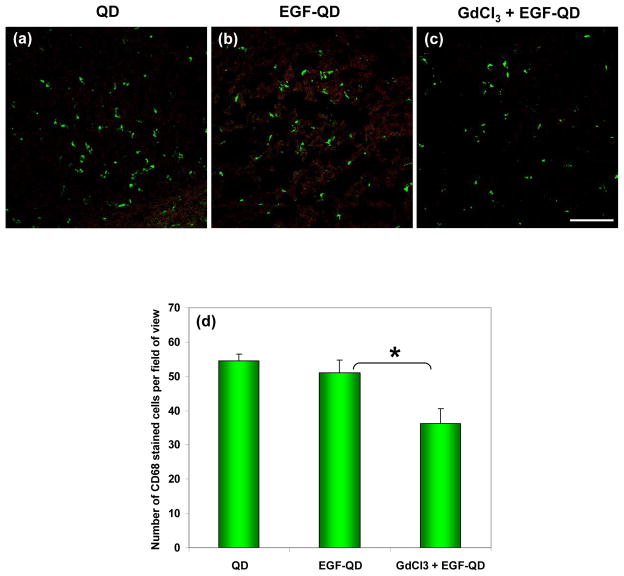
Figure 5.
Activated Kupffer cell–specific anti-CD68 immunofluorescence staining of liver tissues extracted 4 h after (a) QD injection, (b) EGF-QD injection, and (c) GdCl3 pretreatment followed by EGF-QD injection. Green represents CD68 staining, and red represents QD fluorescence. (Scale bar = 50 μm). (d) Quantified CD-68 stained activated Kupffer cells in the liver tissues from each group averaged over different field of views (n=7) shows statistically significant (p < 0.001) difference with and without GdCl3 pretreatment.

