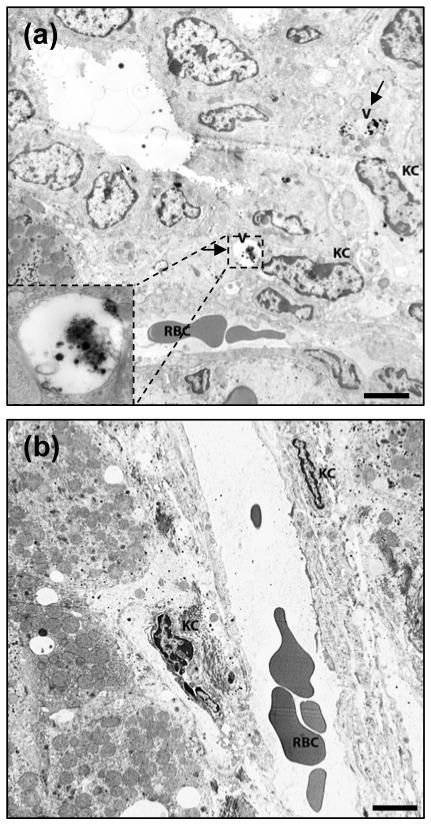
Figure 6.
Transmission electron microscopy image of liver tissue extracted 4 h after (a) EGF-QD injection and (b) GdCl3 pretreatment followed by EGF-QD injection. The arrows in (a) represent the accumulation of QDs in the endocytotic vesicles within the Kupffer cells, and the insert represents the enlarged version of the vesicles containing the QDs. The labels V, KC, and RBC represent the vesicles, Kupffer cells, and red blood cells, respectively. (Scale bar = 5 μm).

