Figure 4.
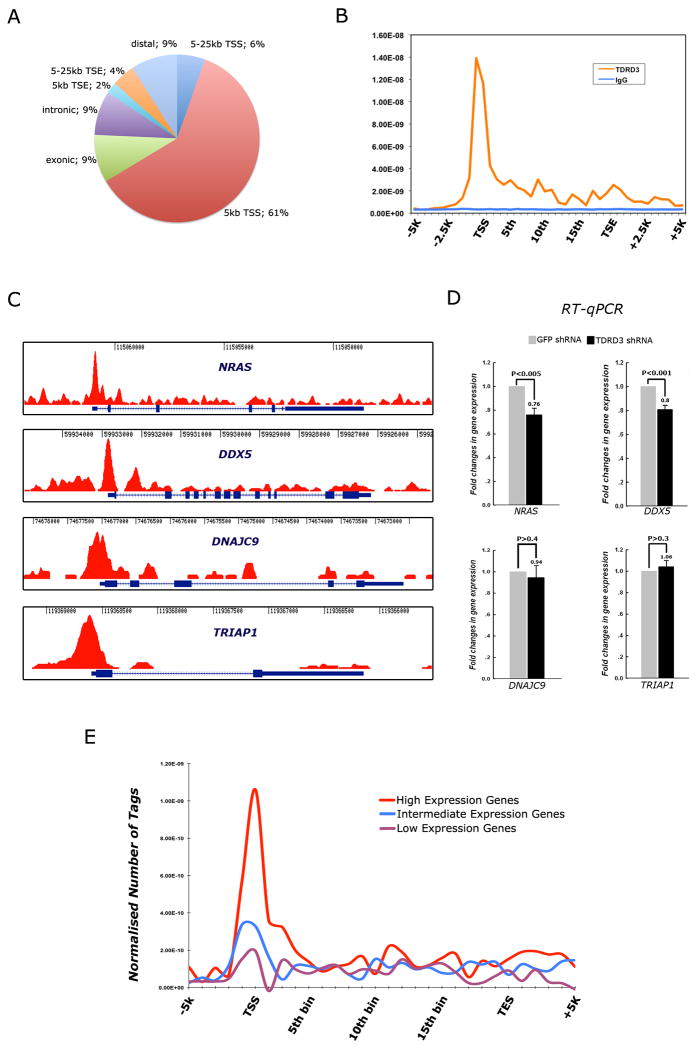
TDRD3 is predominantly recruited to transcriptional start sites (TSS) and promoters of genes. (A) TDRD3 ChIP-seq analysis was performed using MCF7 cells. A pie chart is used to illustrate the genomic regions that are enriched for TDRD3 association. TDRD3 is predominantly coupled to promoter regions, including the TSS. (B) The distribution of TDRD3 was normalized across all genes in which peaks were identified, and its localization spikes over promoters, and displays some enrichment over the gene body. The TSS and TSE (transcriptional end) are shown. (C) Raw reads of the ChIP-seq tracings for four genes – NRAS, DDX5, DNAJC9 and TRIAP1 – demonstrating the enrichment of TDRD3 at promoters. (D) MCF7 cells were transfected with shRNA against GFP or TDRD3. Total RNA was extracted and RT-qPCR was performed to detect the level of gene expression at these four loci. Error bars represent standard deviation calculated from triplicate qPCR reactions. (E) Correlations between the level of gene expression in MCF7 cells and the occurrence of TDRD3 peaks at promoters. Gene expression levels were gauged using Affymetrix arrays (see also Figure S3).

