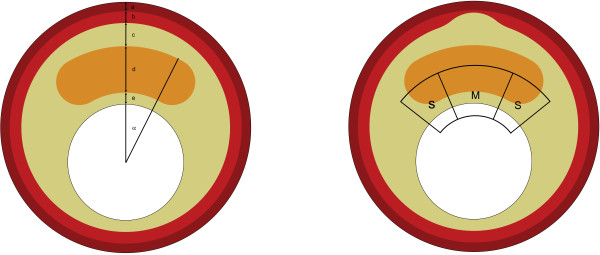
Figure 2.
Examples of computational models. The model on the left panel shows different geometric features: α= Necrotic core angle, a= Adventitia thickness, b= Media thickness, c= Intima thickness behind the necrotic core, d= Necrotic core thickness, and e= Cap thickness. The model on the right panel shows local media regression in the center. S indicates shoulder region and M indicates midcap region. Key to the colors used: brown=adventitia, red=media, yellow= intima, and orange=necrotic core.

