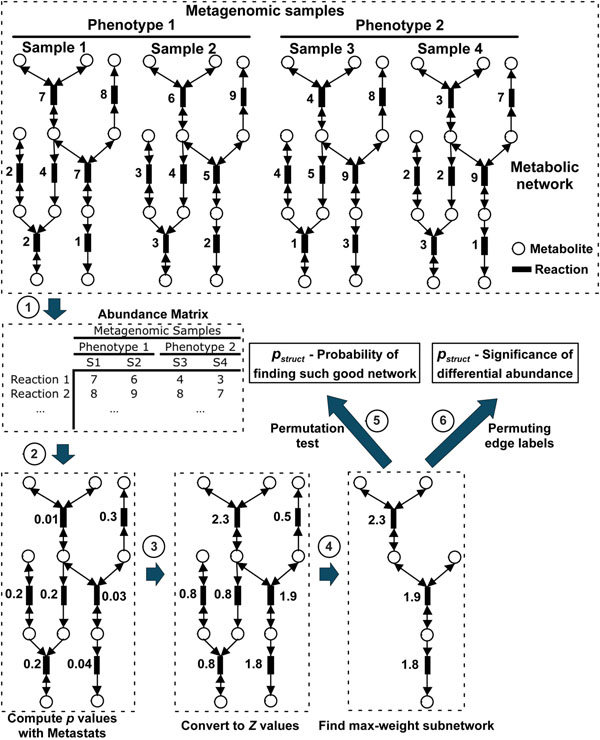
Figure 1.
Schematic diagram of the MetaPath methods. Sequences from each sample are annotated against KEGG genes database and mapped to reactions in metabolic networks, resulting an abundance matrix where the rows are reactions and columns are samples. Then p values are computed for all reactions using Metastats [9], then converted into Z values, and greedy search is performed on the edge-weighted graph to find max-weight subnetworks. Finally, we calculate the pabund and pstruct significance values of the max-weight subnetwork.

