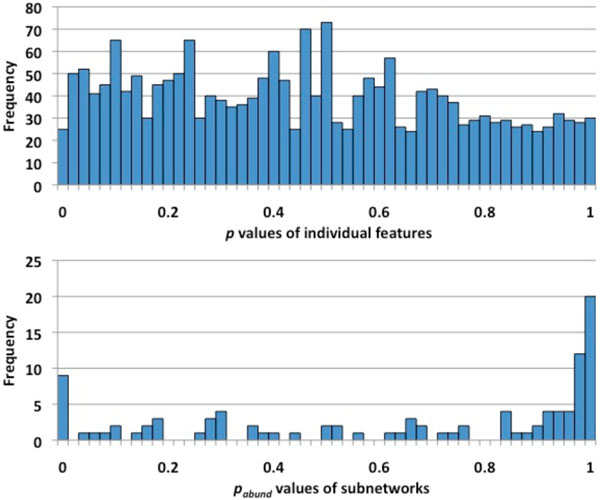
Figure 4.
p values distributions from comparing individual metabolic reactions by Metastats and from comparing metabolic networks by MetaPath. The top histogram is the distribution of the p values of individual metabolic reactions calculated by Metastats. The Bottom histogram is the distribution of the pabund values of the subnetworks calculated by MetaPath.

