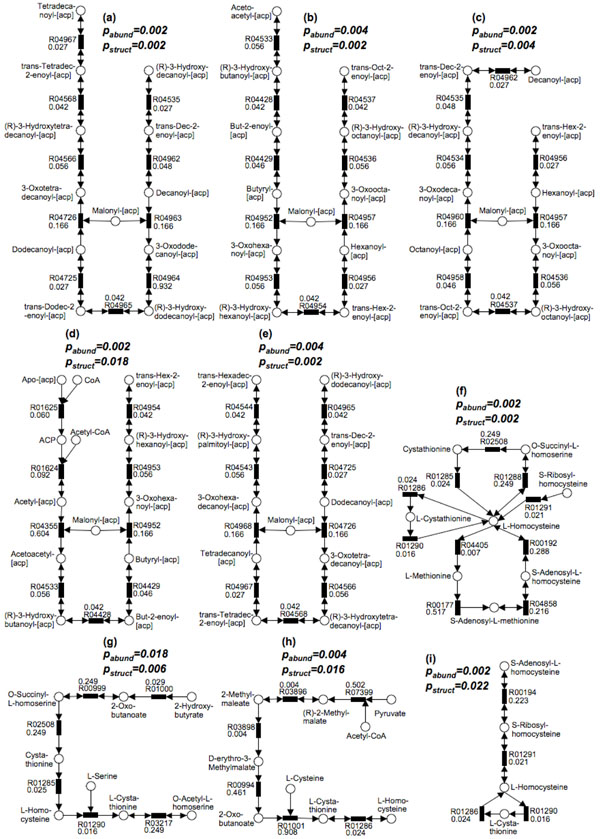
Figure 5.
9 statistically significant subnetworks are found in the comparison of the gut microbiome from the obese and lean subjects. All these subnetworks are enriched in the obese subjects. pabund and pstruct significance values are shown above each subnetwork. p values for each reaction are shown with the KEGG reaction number. Five pathways (a)-(e) belong to the Fatty Acid Metabolism pathway in KEGG. Four pathways (f)-(i) contain the L-Homocysteine molecules.

