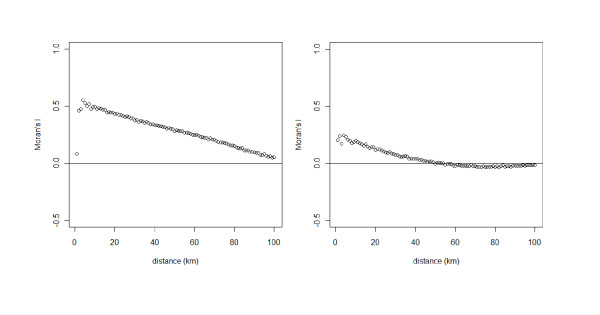
Figure 4.
Correlograms of the residuals from the TSA model (left) and the selected trend SARerr model (right). Correlogram plots Moran's I values on the y-axis against geographic distance in km in the x-axis. Moran's I has an expected value near zero for no spatial autocorrelation, with negative and positive values indicating negative and positive autocorrelation, respectively.

